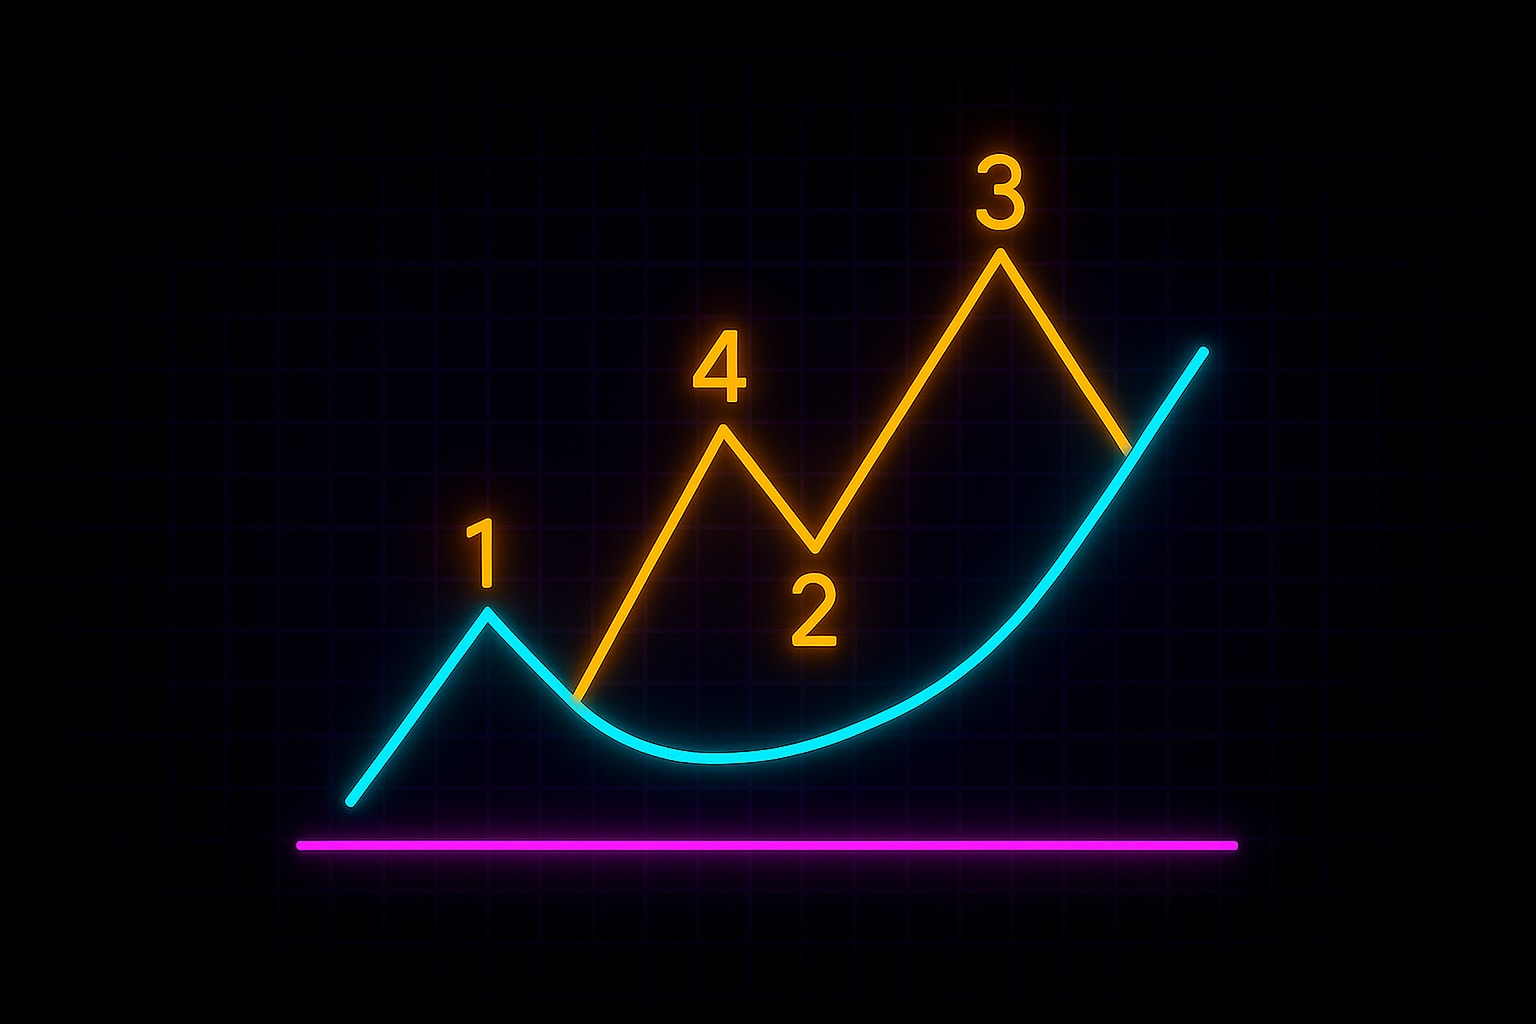
VWAP balances price with volume — a median of conviction that shows whether a move is grounded or drifting.
In this walkthrough, you’ll learn how VWAP reveals the true center of market activity, how to use it as a guide during fast-moving trades, and how to read price reactions around it with more confidence.
Because VWAP isn’t just a line.
It’s where commitment leaves a footprint.
Let’s begin.
VWAP stands for Volume Weighted Average Price. It’s a dynamic level that shows the average price a market has traded at, weighted by volume, over a specific session.
Unlike a simple moving average, VWAP gives more weight to price points where more trades occurred. That makes it a more accurate reflection of where value is building — not just where price has moved.
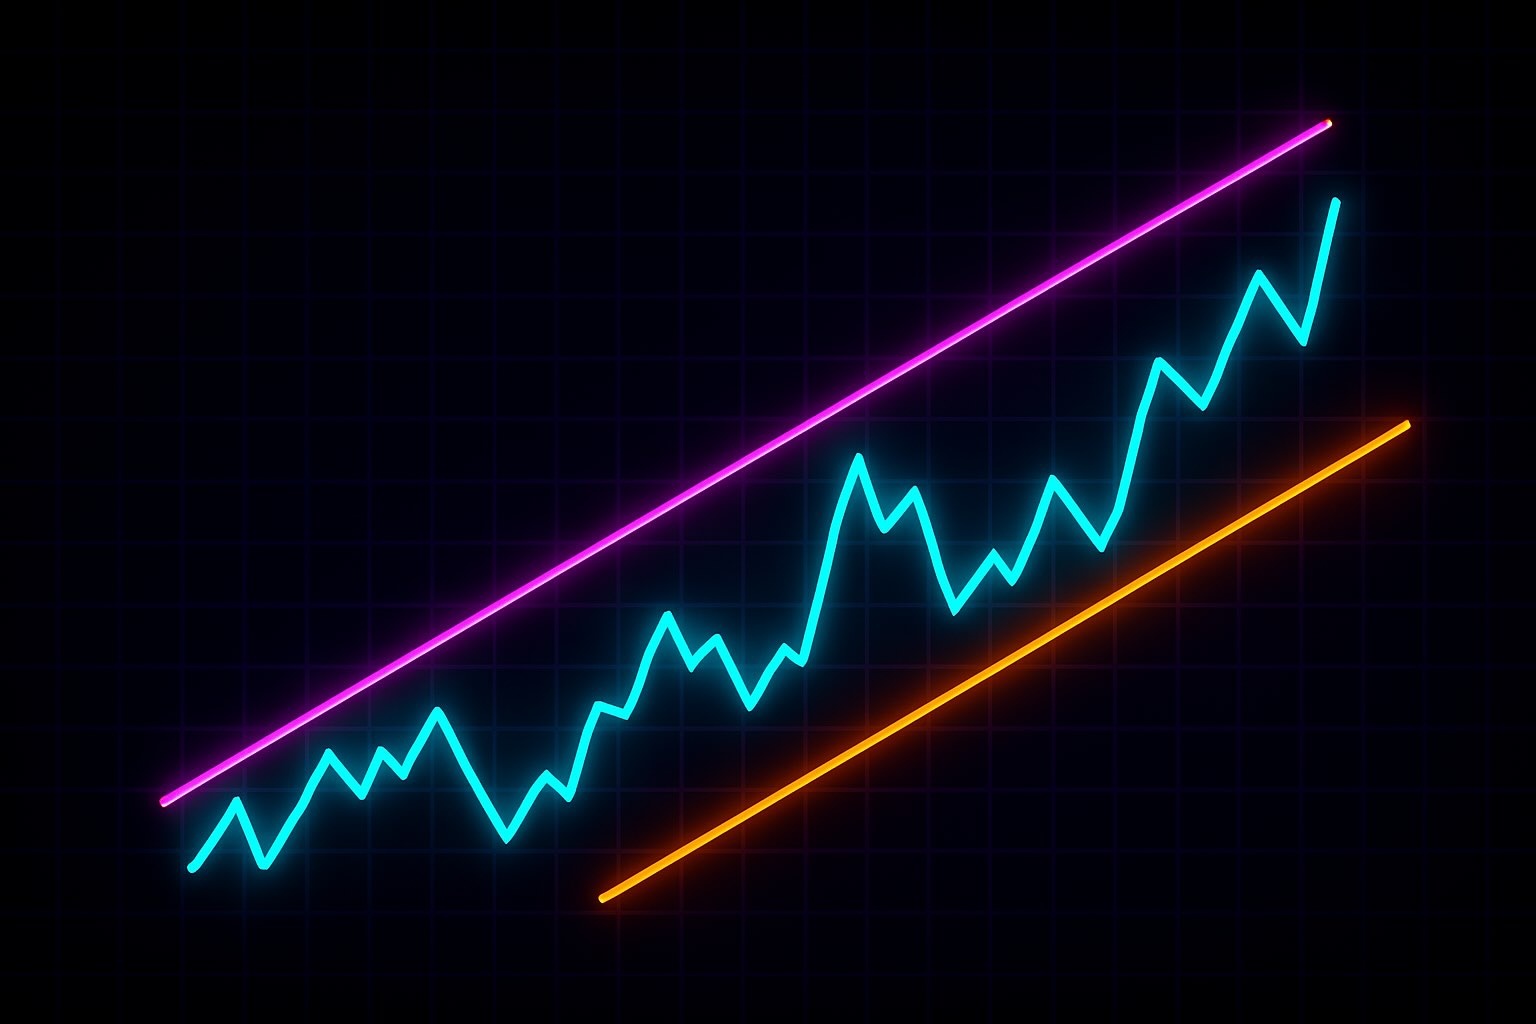
VWAP is often used as an anchor for intraday structure. It tells you where the bulk of trading activity is happening, and whether price is trading above or below that average — which can suggest who’s in control: buyers or sellers.
Institutions often use VWAP to benchmark their trades. Many retail traders use it to find entries, exits, or reversion opportunities. But its real value is in how it helps you stay grounded in the true center of market activity — not just price movement.
VWAP doesn’t predict direction.
It helps you understand where the market is building consensus — and when price is moving away from it.
VWAP appears as a single line on your chart, but it carries more meaning than a typical moving average.
Because it factors in both price and volume, VWAP tells you where the majority of trades are taking place — not just where price has gone. That makes it more reliable for identifying the real center of intraday structure.
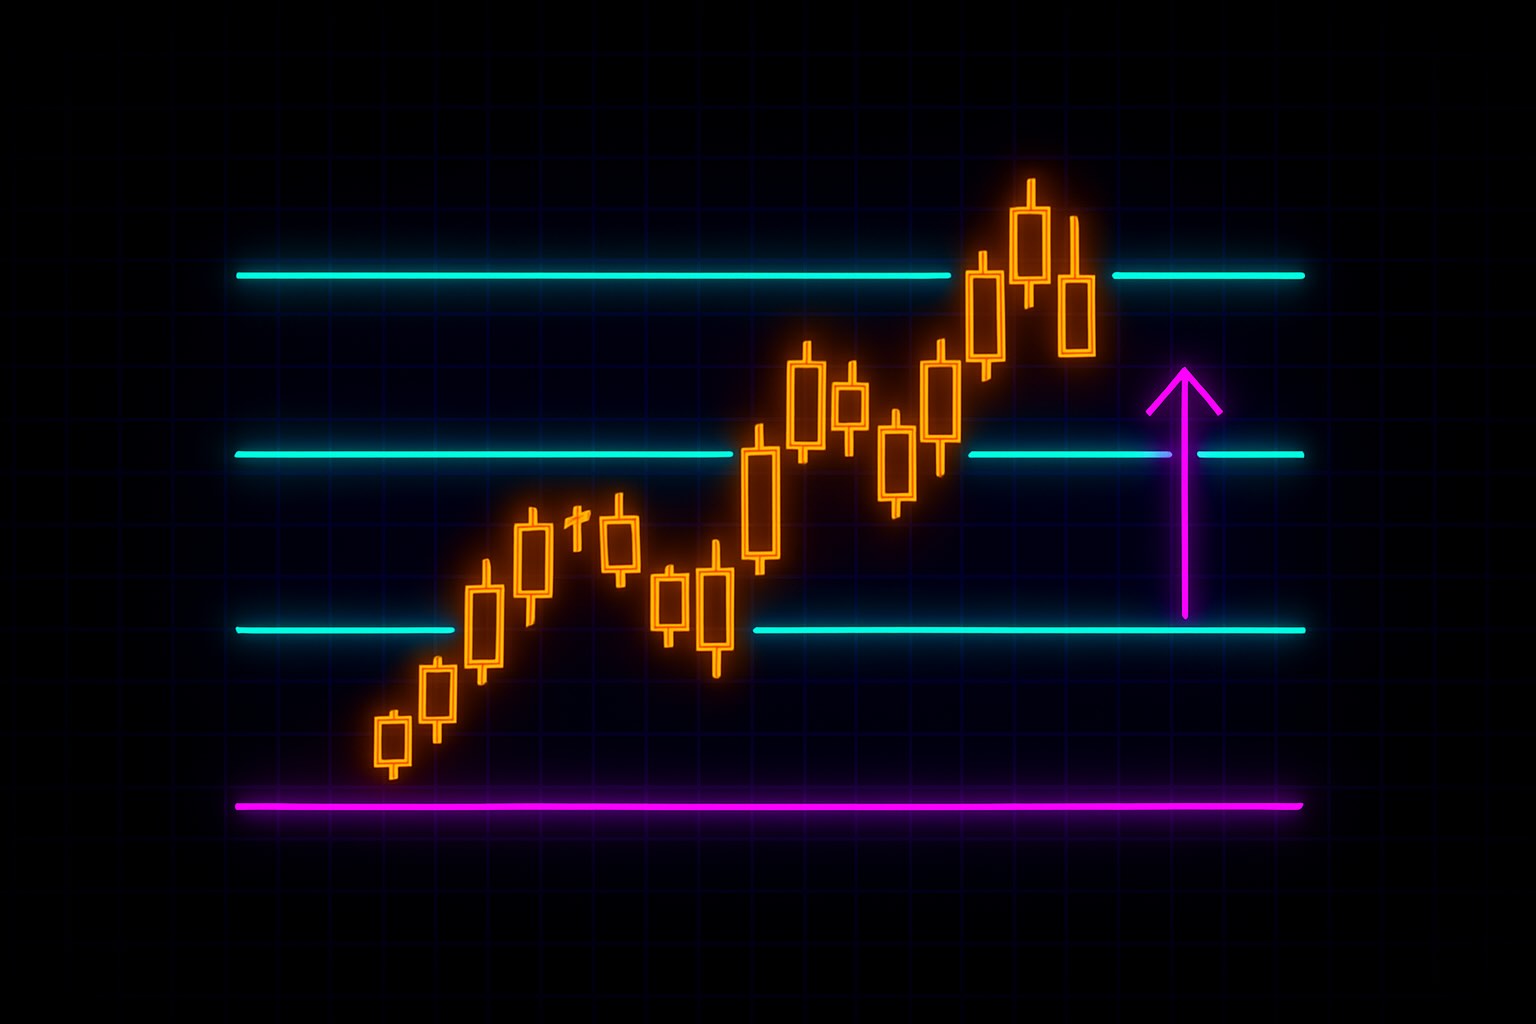
When price is above VWAP, it means the current market is trading at a premium compared to the average price paid. This often reflects bullish control — or at least short-term buying pressure.
When price is below VWAP, it suggests the market is trading at a discount — and sellers may have the upper hand.
But price crossing VWAP isn’t a signal by itself. What matters is:
VWAP resets each session, which means it adapts to the day’s activity in real time. That makes it especially helpful during the first few hours of trading — when new structure is forming.
You don’t use VWAP to predict the next move.
You use it to understand where value is building — and whether price is respecting or rejecting that zone.
VWAP is most useful during active sessions where structure is still forming — especially in intraday trading. It gives you a live reference point to understand where the market sees fair value, and how price is behaving around it.
You use VWAP when:
VWAP is especially effective when combined with:
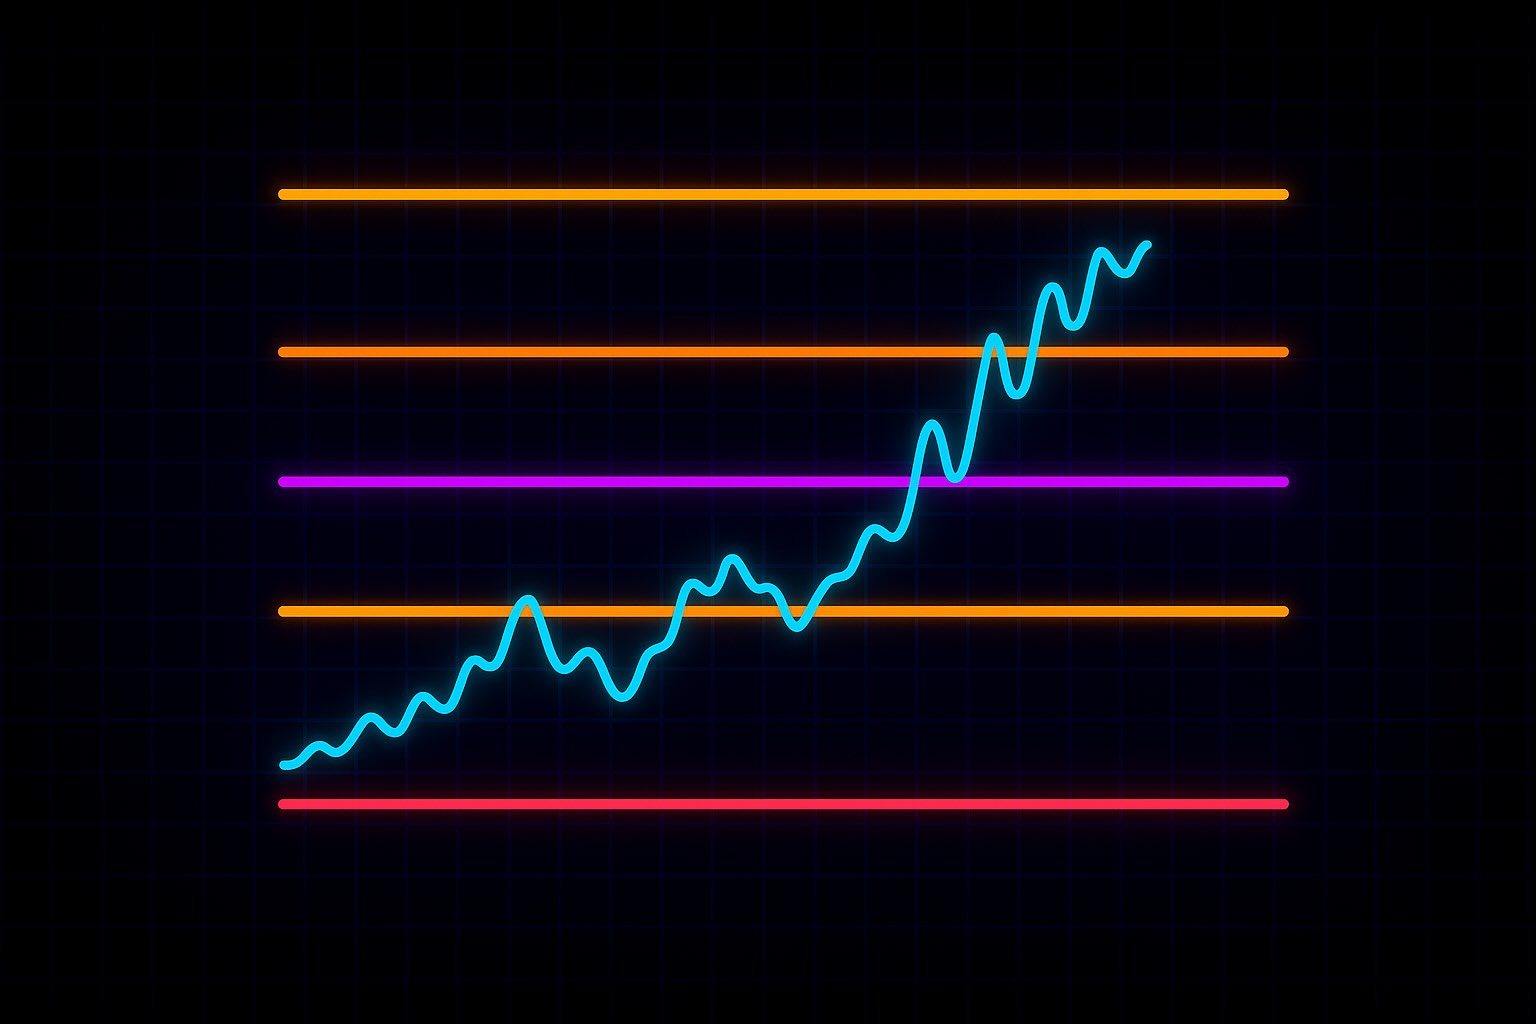
But VWAP isn’t always active. If price is choppy and keeps crossing VWAP with no reaction, it may mean the market is balanced — and structure hasn’t formed yet.
A clean bounce, rejection, or retest around VWAP matters more than the line itself.
At its best, VWAP helps you stay grounded in what’s actually being traded — not just where price is drifting.
Let’s follow Ava — a short-term trader who uses VWAP to stay anchored during fast-moving sessions.
It’s Wednesday. Solana (SOL) has gapped up slightly overnight and opens at $145. Ava loads her chart and sees VWAP printing near $144 — just below the open.
For the first 30 minutes, price hovers above VWAP, pushing toward $147. Volume is healthy. Ava doesn’t chase the move. She watches to see how price behaves if it returns to the average.
Soon, a pullback begins. Price dips toward VWAP, now flattening near $144.80.
Ava starts looking for confirmation. She doesn’t assume VWAP will hold — she watches the reaction.
Now she has confluence: VWAP + memory + reaction.
A bullish engulfing candle closes back above $145. Ava enters long.
She places her stop just below VWAP. If price can’t hold the average, the setup is invalid. Her first target is $147 — the morning high. If that level breaks cleanly, she plans to let the rest run.
Price pushes higher and retests $147. She locks partial profit. The remainder continues to $149 before momentum fades.
Later in the session, price returns to VWAP — but this time with weakness:
Ava stays out.
Same line — different behavior.
VWAP didn’t give her the trade.
It gave her the context to evaluate the trade.

VWAP is only useful if the market reacts to it.
Just like any other structure, its value comes from behavior — not presence.
Ava doesn’t trade just because price touches VWAP.
She watches how price approaches, interacts with, and responds to it.
Here’s what she looks for:
She treats VWAP like any other dynamic structure:
It’s not about the line — it’s about the reaction around the line.
A clean bounce with confirmation? That’s a setup.
A sloppy crossover with no volume? She moves on.
VWAP is the market’s real-time average of commitment.
Ava’s only interested when the market respects it.
Ava starts each session by identifying VWAP — it’s automatically plotted on her chart and resets daily. She sees it as the center of balance for the session — where the bulk of volume has agreed on value.
She doesn’t treat it as a signal. She treats it as a reference.
If price is trading above VWAP, she leans bullish — but only if price is holding and reacting cleanly. If price is below, she leans bearish — but not without confirmation.
She always watches how price interacts with the line:
Her focus isn’t on touching the line — it’s on what happens when the market reaches it.
She also looks for alignment:
Is VWAP overlapping with a prior high, a support zone, or a trendline?
The more signals agree, the more likely the level is valid.
And most importantly, she stays adaptive.
VWAP can flip intraday. What was support in the morning may become resistance later. If structure shifts, so does her plan.
For Ava, VWAP doesn’t tell her when to enter.
It tells her when price is moving with — or against — value.
VWAP is not about signals. It’s about balance.
It shows you where the market has agreed on value — not just where price has moved. And when price moves away from that value, it helps you ask the right questions:
Is this momentum — or just a stretch?
Is value shifting — or holding?
At Kodex, we don’t treat VWAP as a trigger.
We treat it as structure — something to observe, measure against, and act upon only when confirmed by behavior.
Used with intent, VWAP keeps you grounded.
It helps you avoid emotional entries, clarify bias, and stay focused on where real activity is building — not just where price is drifting.
Let VWAP frame the session.
Let the market show you whether it respects the average.
And let structure, not urgency, shape your decisions.