What looks chaotic is often structured. Ichimoku reveals the layers of trend, time, and confirmation.
In this walkthrough, you’ll learn how to:
This tool doesn’t predict the future.
It shows you if price, time, and trend are in sync.
Because in real trading, one line isn’t enough.
You need alignment — or you wait.
Let’s begin.
The Ichimoku Cloud was built to give traders a full view of market conditions — not just price, but momentum, trend direction, and support/resistance — all in one glance.
At first, it can look overwhelming. But behind the complexity is a simple idea:
Balance.
The cloud helps you see whether the market is in equilibrium, leaning bullish, or tilting bearish — and whether that balance is gaining strength or breaking down.
It’s not a typical indicator. It doesn’t wait for a signal to confirm.
Instead, it shows whether the current price is aligned with past and future structure — using multiple components to map out that relationship.
Ichimoku is not about prediction.
It’s about alignment — between price, trend, momentum, and time.
When these elements line up, the cloud becomes more than a chart overlay.
It becomes a framework for clarity.
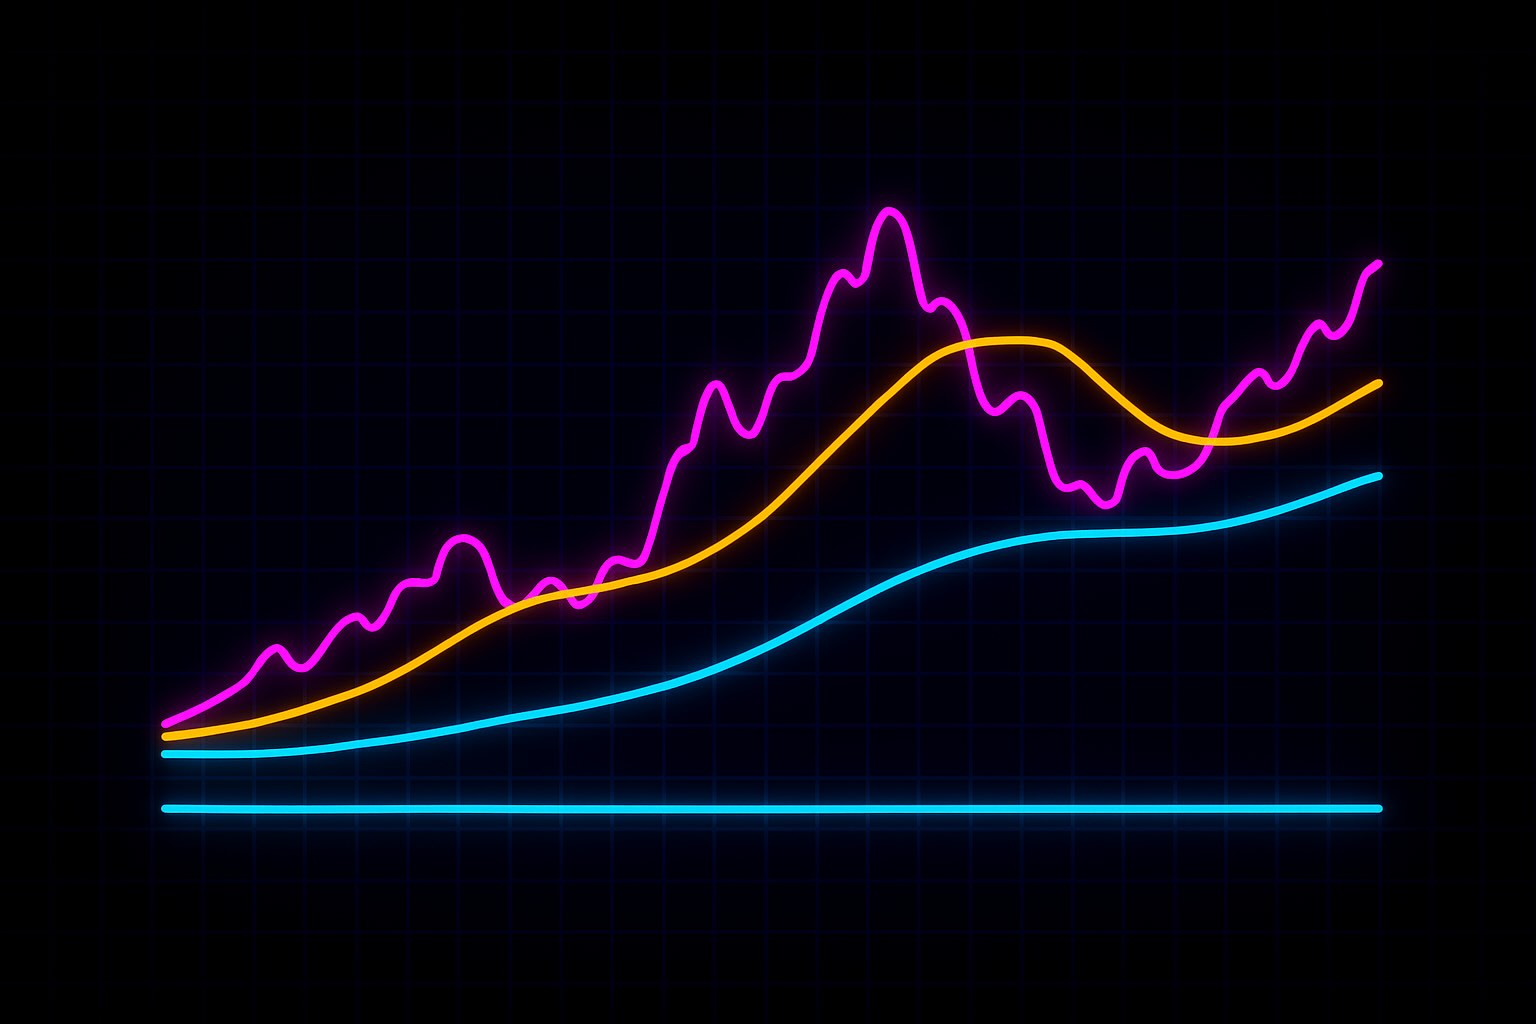
The Ichimoku system is made up of five lines — but most of the insight comes from how they relate to each other, not just from their individual values.
Let’s break down the core components:
1. Tenkan-sen (Conversion Line)
This is the short-term average — calculated as the midpoint of the last 9 candles.
It reacts quickly and shows short-term momentum. When price is above the Tenkan-sen, it suggests strong directional intent.
2. Kijun-sen (Base Line)
This is the medium-term average — based on the last 26 candles.
It’s slower and more stable. When price is above the Kijun-sen, it often reflects support and trend direction. The Kijun is also a reference point for possible pullbacks.
3. Senkou Span A (Leading Span A)
This line is calculated by averaging the Tenkan-sen and Kijun-sen — and projected 26 candles into the future. It forms one edge of the cloud.
4. Senkou Span B (Leading Span B)
This line is the midpoint of the last 52 candles — also projected forward 26 candles. It forms the other edge of the cloud.
Together, Span A and Span B create the “Kumo” — the Cloud.
5. Chikou Span (Lagging Span)
This is the current price — plotted 26 candles in the past. It shows how current price compares to historical structure, offering a quick view of relative strength.
While each line can offer a signal, the real strength of Ichimoku comes from alignment.
When all elements agree — price above the cloud, Tenkan above Kijun, Chikou above price — the system is in balance. When they diverge, that balance starts to weaken.
You’re not watching just one signal.
You’re reading how momentum, structure, and time are interacting.
Ichimoku is best used when you want a complete view of trend structure — not just where price is, but how it’s moving in relation to short-term momentum, medium-term support, and historical balance.
It works well in:
It’s especially helpful when:
But Ichimoku is less effective when:
The tool is meant to be read as a whole system.
You’re looking for alignment — not perfection. If price, cloud, and momentum agree, the structure has weight. If they’re mixed, it’s a sign to wait.
Ichimoku isn’t for prediction.
It’s for filtering noise and focusing on structure.
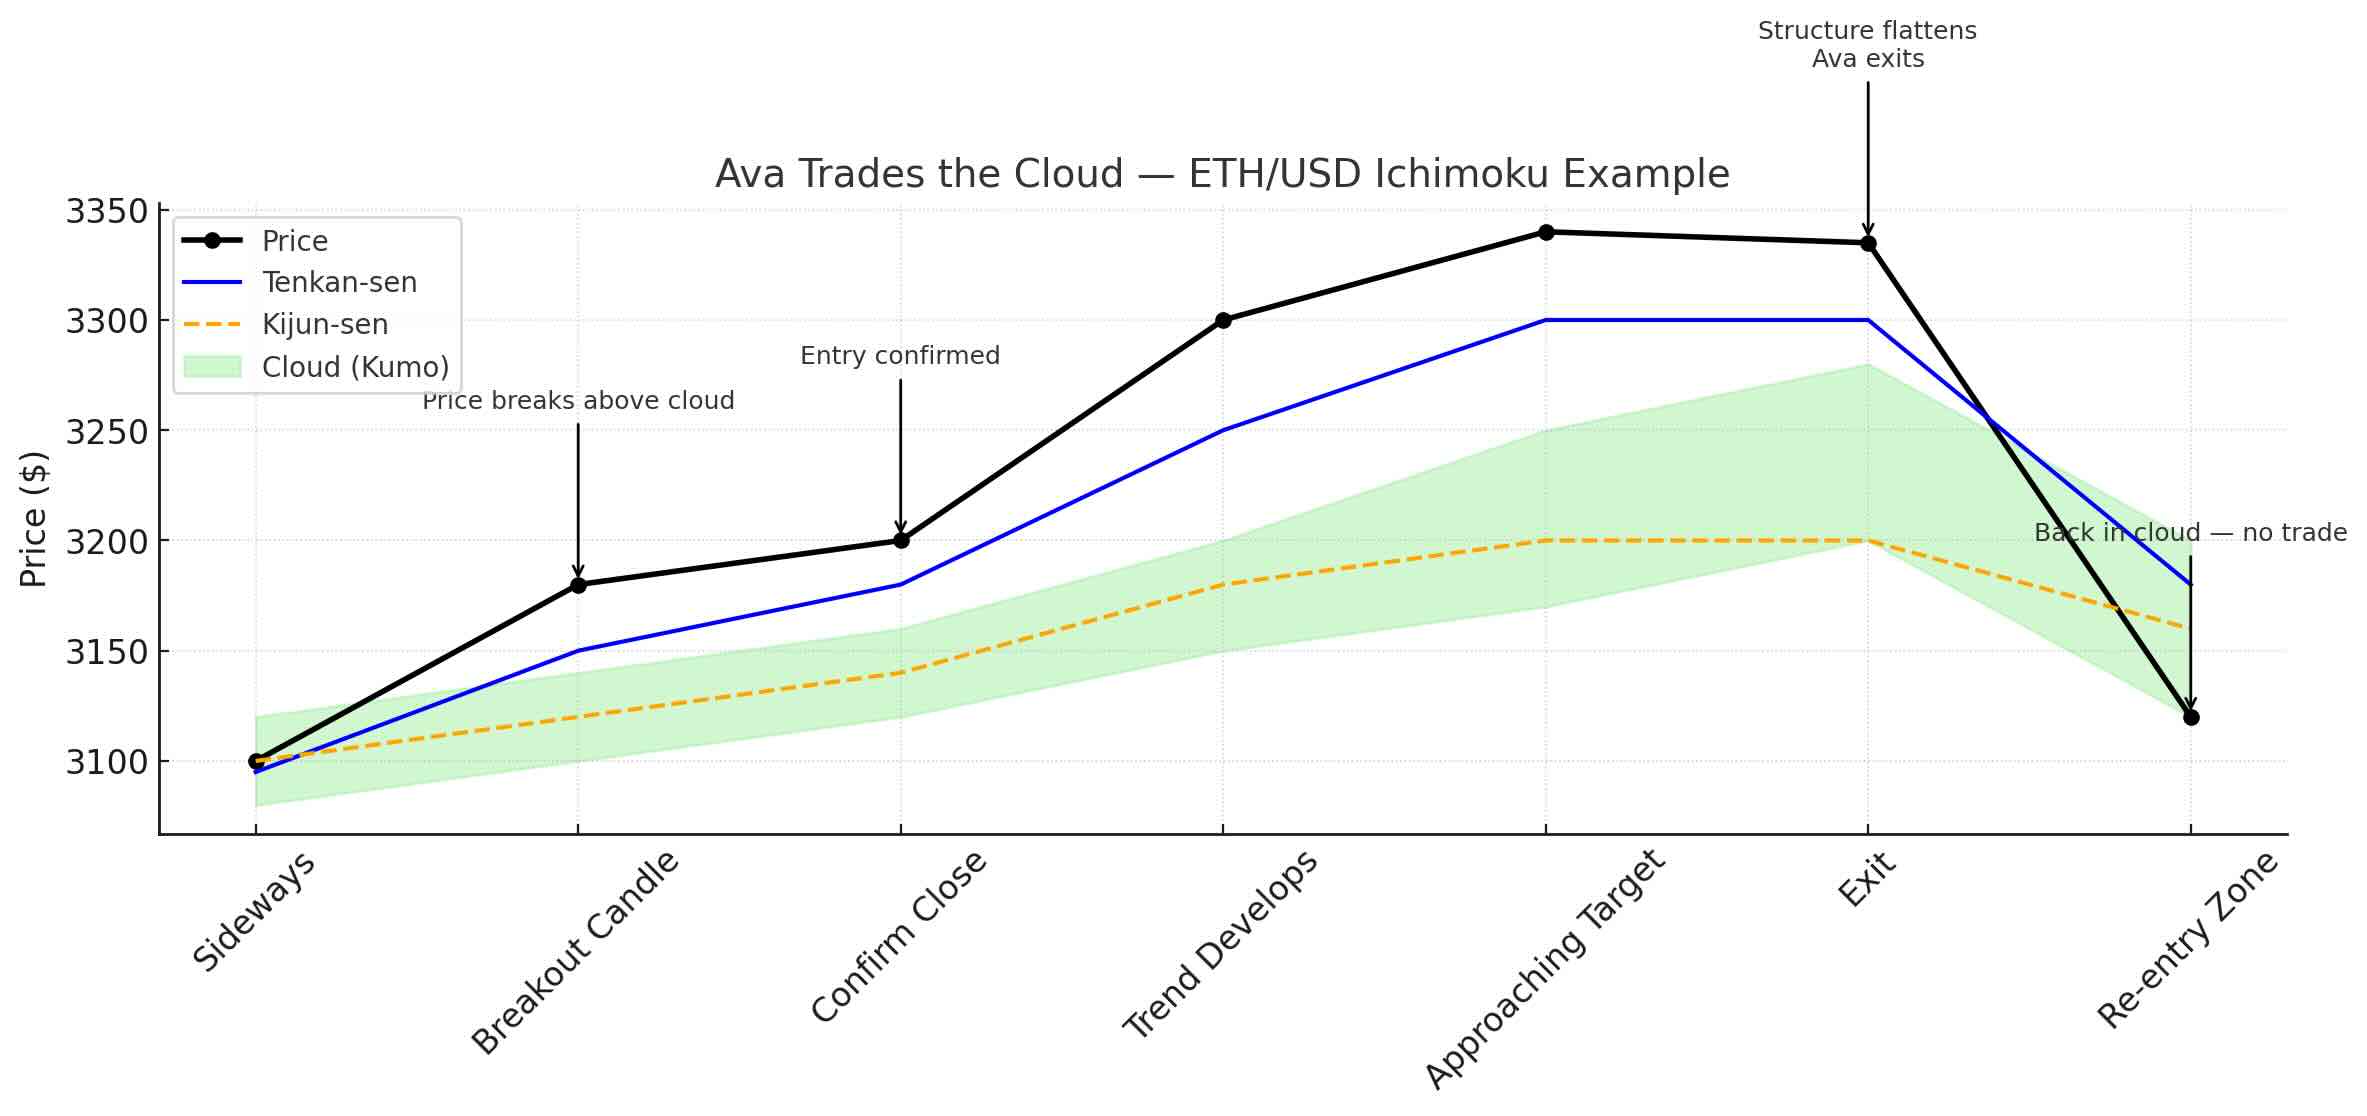
Let’s follow Ava — a swing trader who uses structure to stay aligned with the market, not ahead of it.
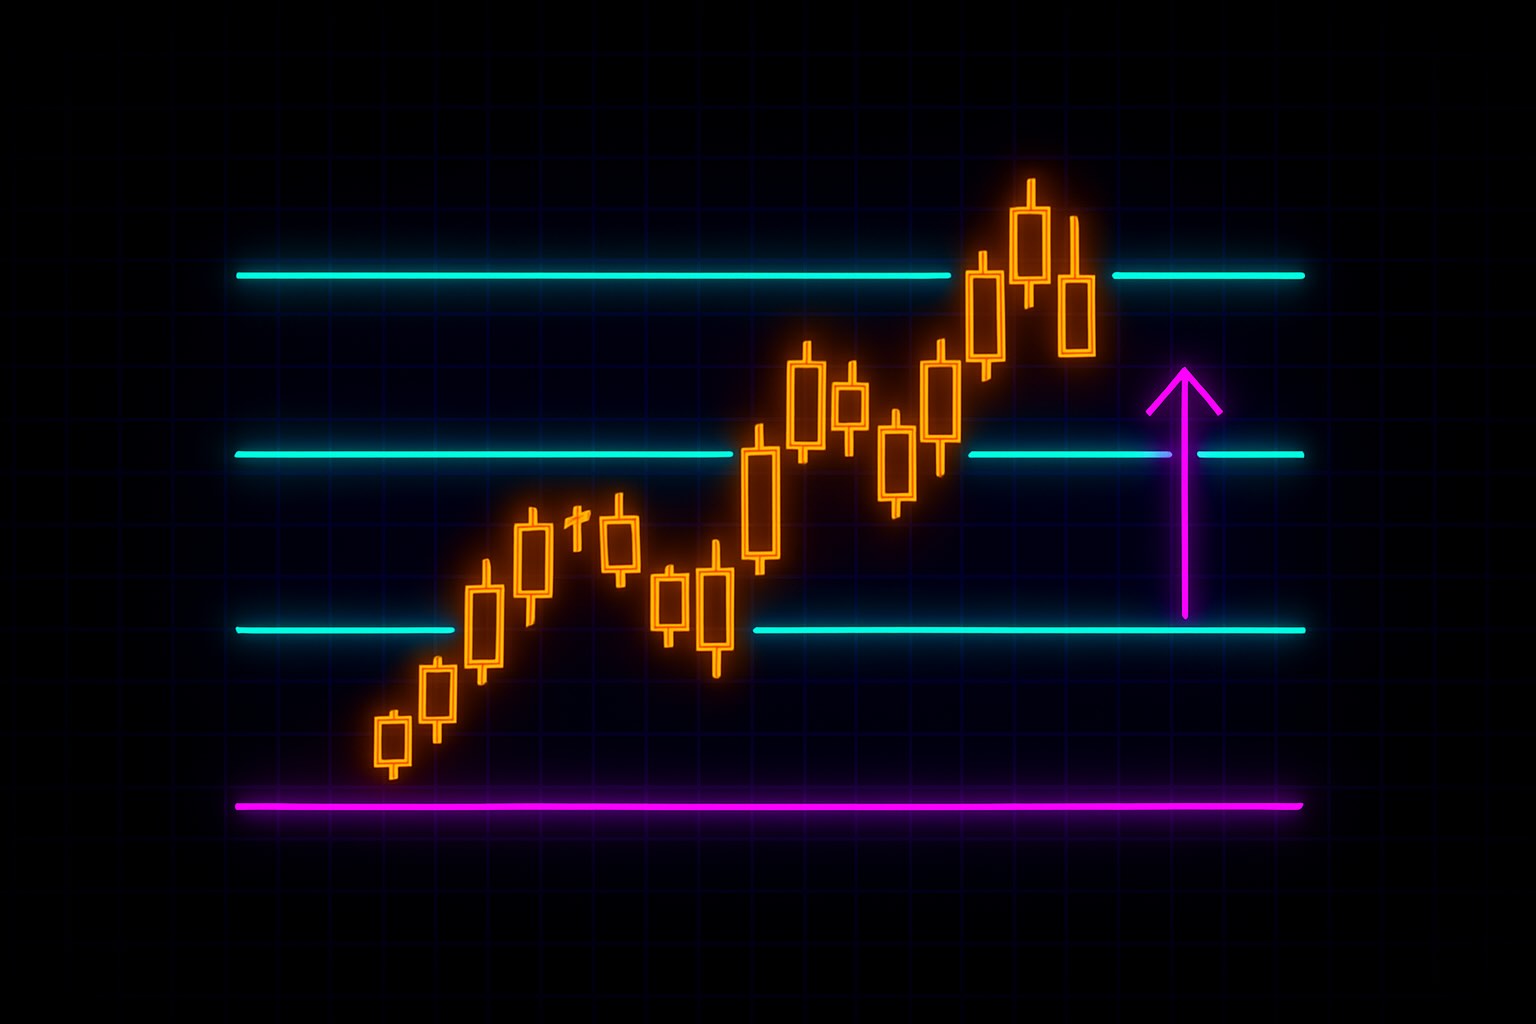
Ethereum has been moving sideways for weeks, hovering around $3,100. Ava has been watching the chart, waiting for signs of a shift. The cloud is flat, and price has been trading inside it — a sign of indecision and balance, not momentum.
But on Monday morning, something changes.
Price breaks above the cloud with a strong bullish candle. At the same time, she notices three things:
This is alignment.
Ava waits for the next candle to close above the cloud to confirm the breakout. When it does, she enters long — not on the first move, but once the structure is fully in place.
Her stop-loss goes just below the Kijun-sen — the medium-term base of the structure.
Her target is a recent swing high at $3,350 — a logical resistance zone.
As the trade develops, Ava sees Tenkan and Kijun holding below price. The cloud is thickening — showing strong projected support. There’s no reason to exit early.
But near $3,340, price begins to slow. The Tenkan starts to flatten. Ava closes the position before resistance hits — letting the structure guide her exit, just as it framed her entry.
A few days later, price dips back into the cloud. Ava doesn’t chase the next move. She waits again — for clarity.
Ichimoku didn’t give her a signal.
It gave her a complete view — and the discipline to act only when the pieces aligned.
The Ichimoku Cloud isn’t a signal generator — it’s a structure.
To use it well, you need to focus on how price reacts to that structure.
Ava doesn’t treat a cloud breakout as automatic confirmation. She asks:
She watches how price behaves around the cloud — not just whether it crosses a line.
If all components are aligned and price respects the structure, Ava acts.
If behavior is mixed, she waits.
The cloud doesn’t tell her what to do.
It shows her when clarity is present — and when it isn’t.
Ava doesn’t use Ichimoku to guess where price will go next.
She uses it to decide when the market is aligned enough to act with confidence.
Each morning, she checks the chart in stages. First, she looks at price relative to the cloud. If it’s trading inside the cloud, she knows the market is in balance — and likely not worth trading yet. If price is above or below the cloud, she looks deeper.
Next, she checks the relationship between the Tenkan and Kijun lines. A bullish crossover, with Tenkan above Kijun, supports upward momentum. But she doesn’t act on that alone — she wants to see both lines moving, not flattening.
Then, she glances at the Chikou Span. Is it above current price and past structure — or stuck in a congested zone? If it’s confirming direction, the setup gains strength. If it’s unclear, she holds back.
She also scans the cloud ahead. A green, widening cloud shows projected support. A thin or twisted cloud warns her that structure may break easily.
Finally, she checks price behavior. She doesn’t trade the breakout itself.
She waits for a confirmed close beyond the cloud, with momentum and structure in agreement.
If the system is in alignment, Ava builds the trade.
If even one part is off — she waits. Ichimoku helps her stay in sync with the market, not rush ahead of it.
The system doesn’t give her answers.
It filters the noise — so she can focus only when the market is clear.
Ichimoku isn’t about prediction. It’s about alignment.
It gives you a complete view of market structure — showing you whether momentum, support, and time are working together or pulling apart.
At Kodex, we don’t trade based on isolated lines or signals.
We look for agreement — between price, context, and behavior.
The cloud helps frame that alignment.
If the structure is clean, we engage.
If it’s unclear, we wait.
Ichimoku doesn’t remove uncertainty — but it helps you see when the market is balanced, trending, or indecisive. That clarity gives you discipline. And discipline builds consistency.
Let the cloud show you the structure.
Let the reaction confirm the intent.
And let alignment — not assumption — guide your trade.