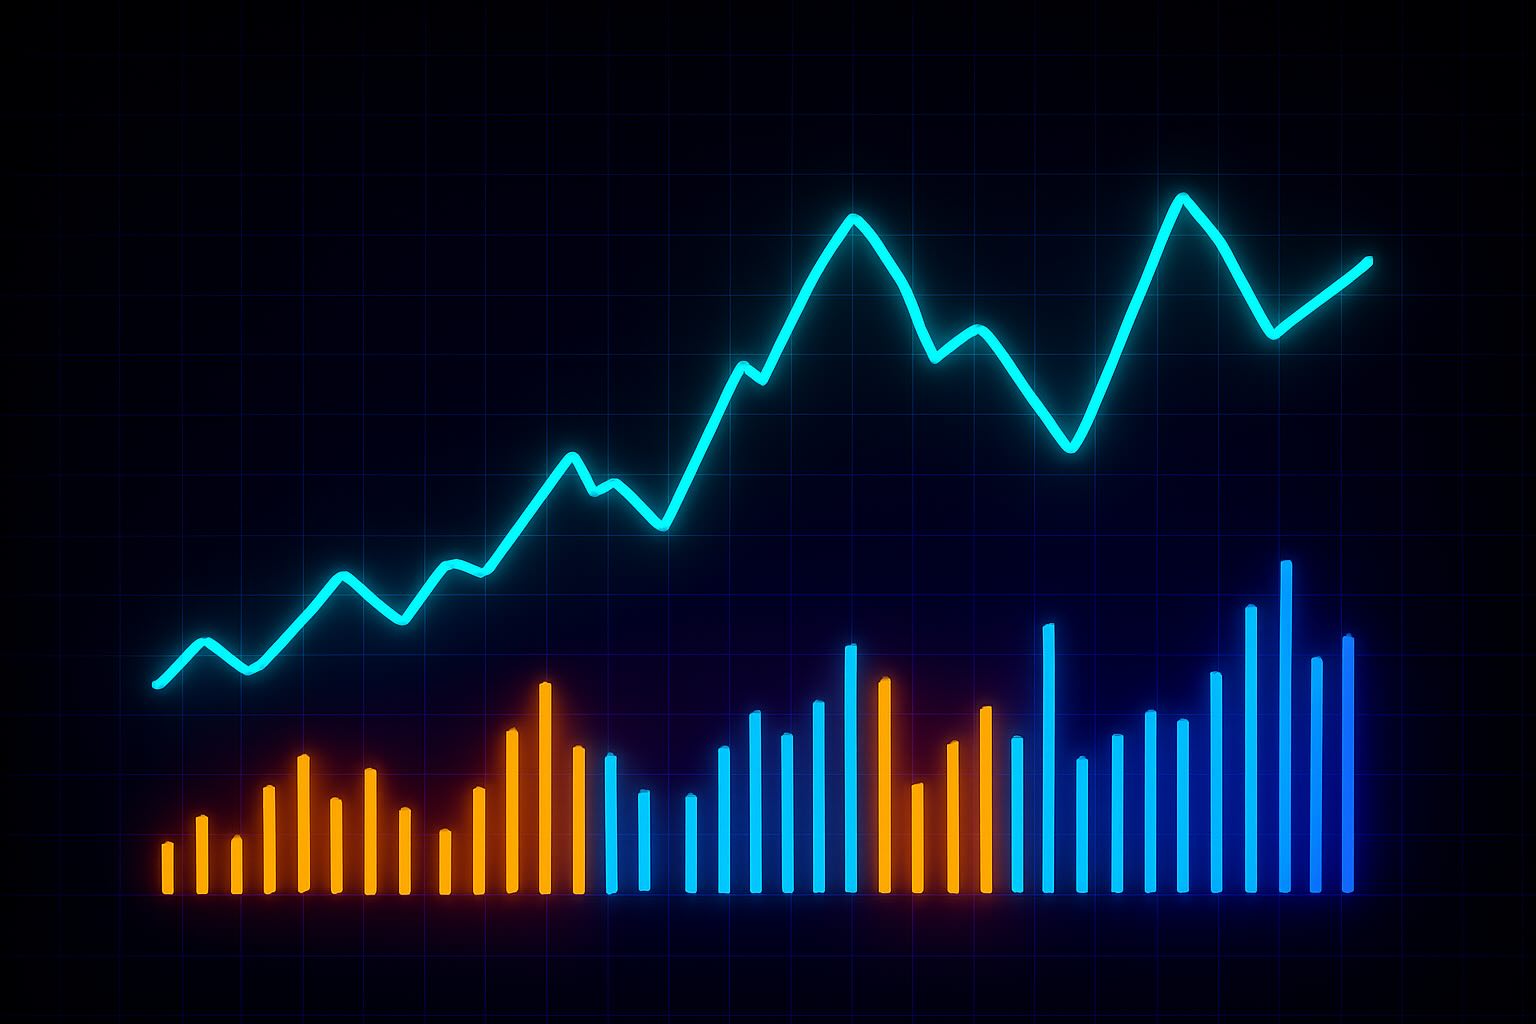
Volume Patterns
Tracks the force behind the move. Helps confirm price direction — and spot when sentiment is shifting underneath.
Explore The How
Volume Patterns

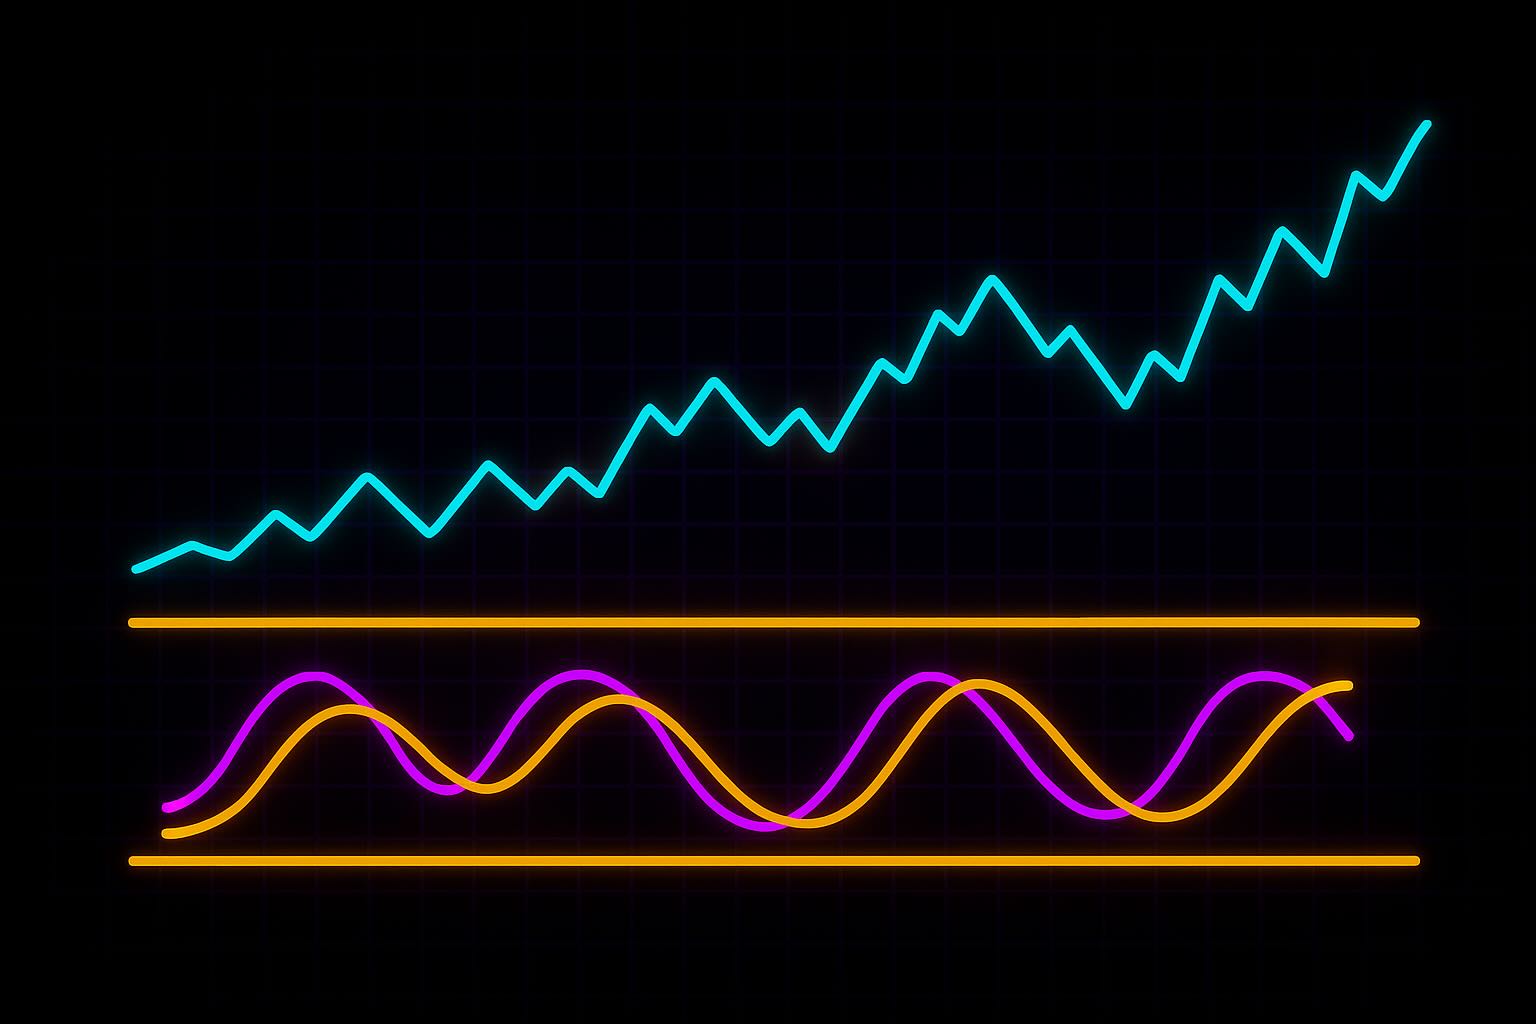
Relative Strength Index
Tracks how strong — or tired — a move really is. Highlights potential reversals when pressure builds at the extremes.
Explore The How
Relative Strength Index
Trend Analysis & Momentum
VWAP
Shows where most trading happened. Helps you spot fair value and stay aligned with real market pressure.
Explore The How
VWAP

Average True Range
Volatility made visible. ATR shows how wide the swings are, so you can set smarter stops and manage position size.
Explore The How
Average True Range
Relative Vigor Index
When price moves, conviction matters. RVI shows whether the push has real strength — or is fading fast.
Explore The How
Relative Vigor Index
Trend Analysis & Momentum

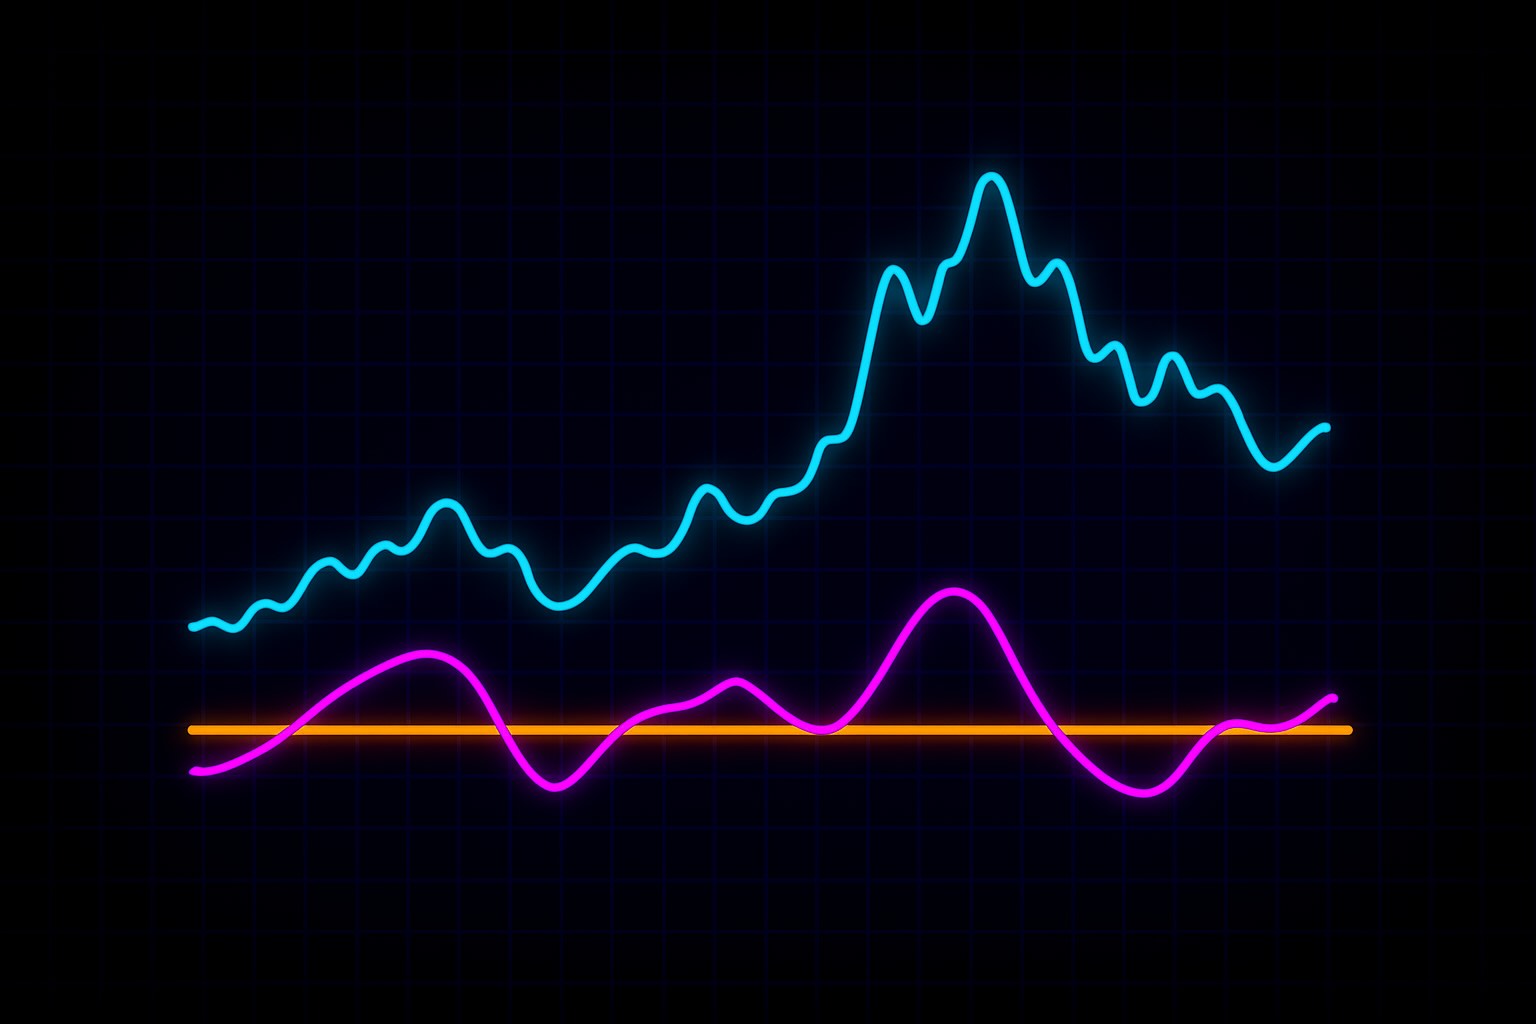
MACD
Momentum tells the truth before price does. This tool helps you catch early signs of reversals and follow-through.
Explore The How
MACD
Trend Analysis & Momentum
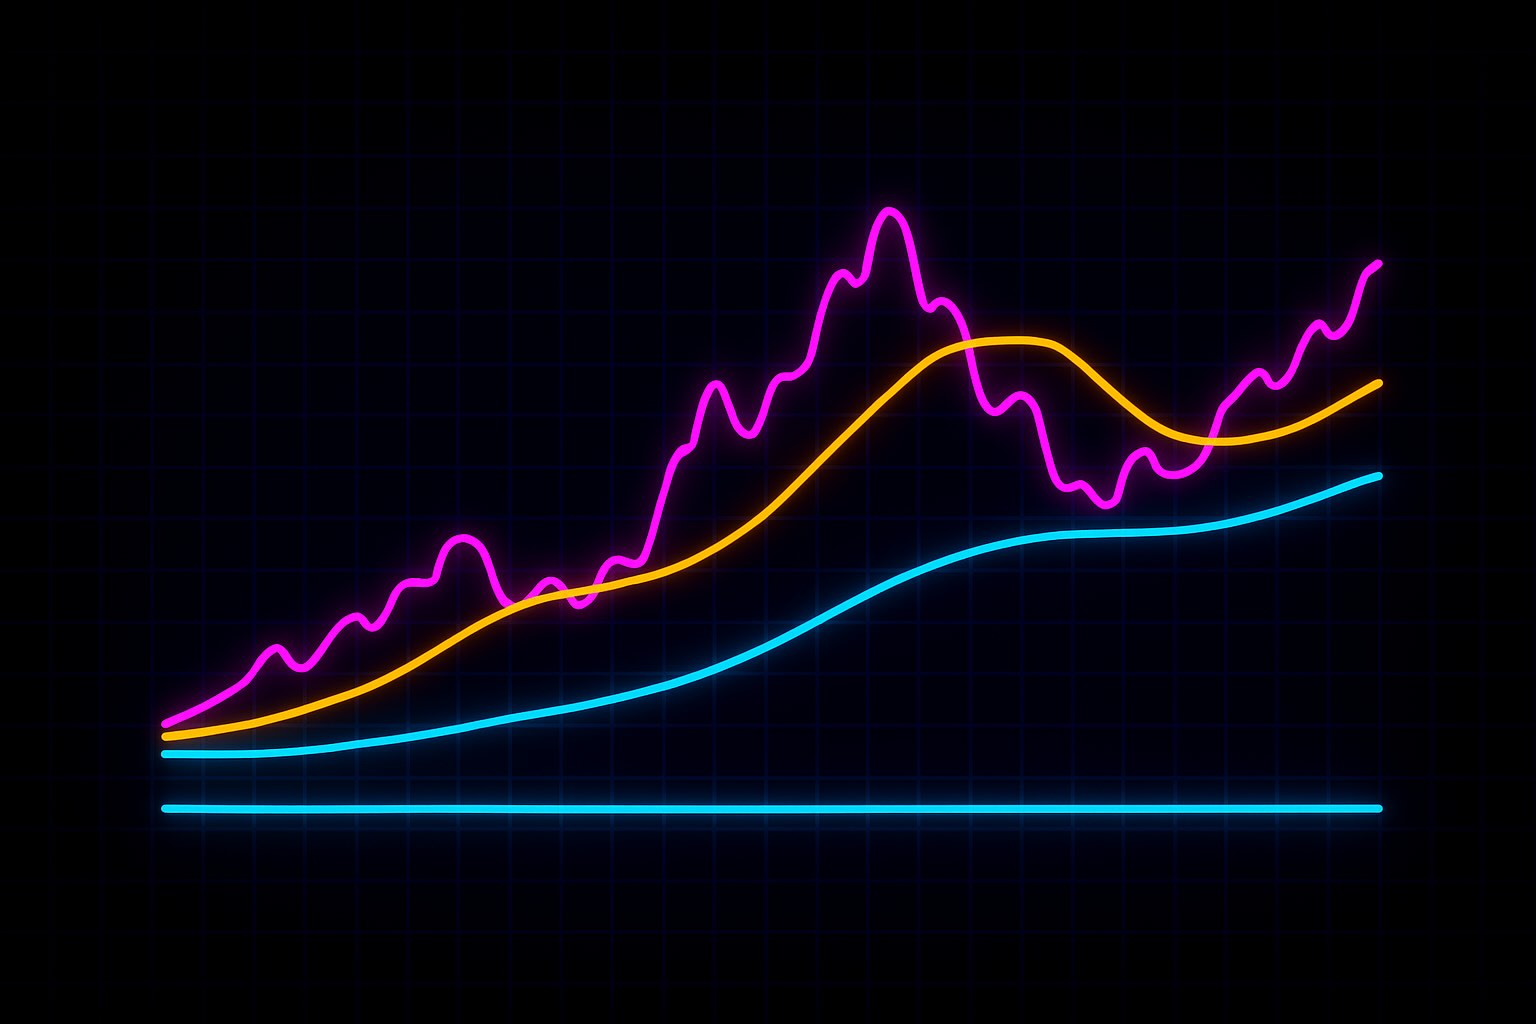
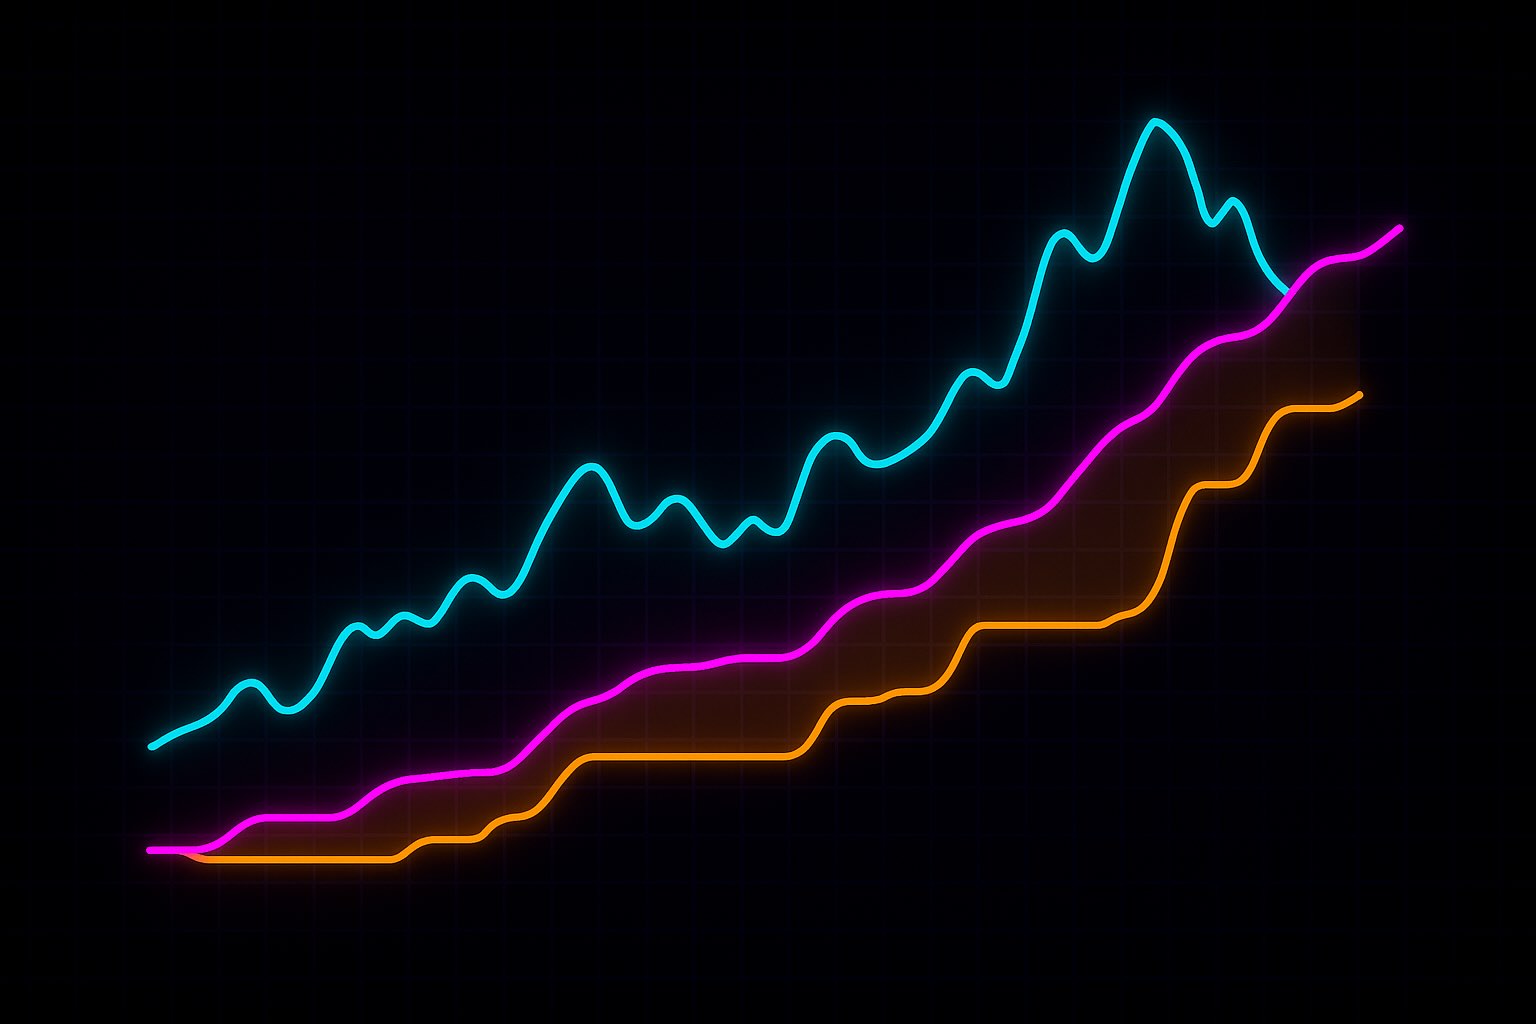
Moving Averages
Track the market’s direction over time. Reveals trend strength and where support may form along the way.
Explore The How
Moving Averages
Trend Analysis & Momentum
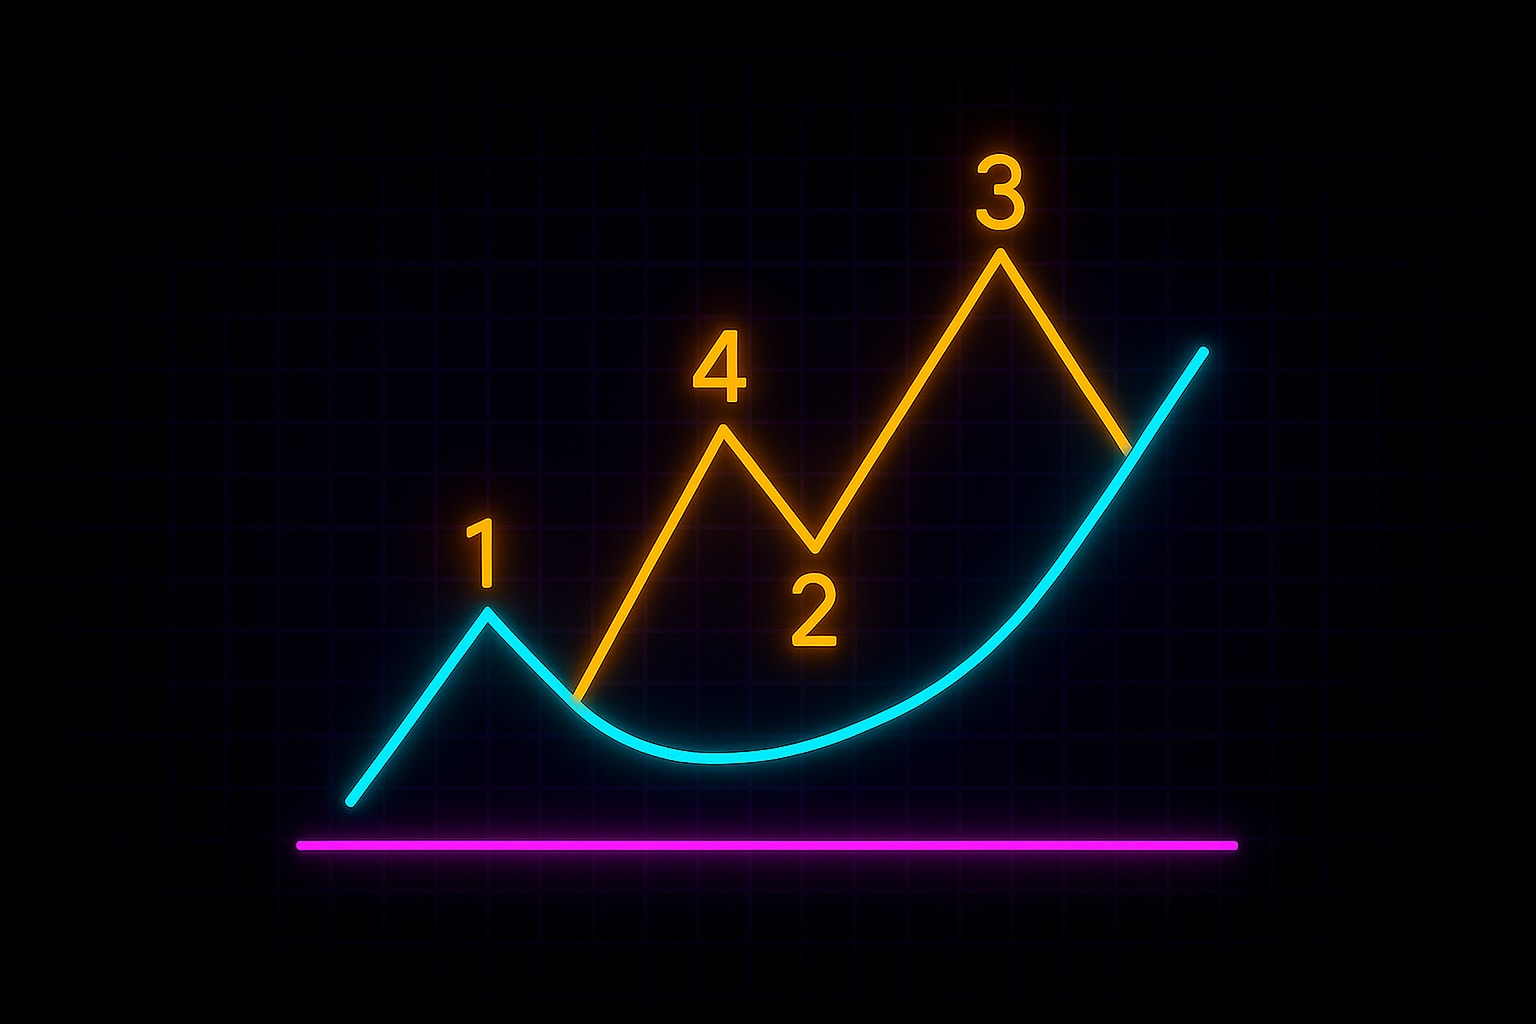
Elliot Wave Theory
Markets move in waves — not straight lines. This tool helps you recognize those cycles and prepare for what might come next.
Explore The How
Elliot Wave Theory
Support, Resistance & Patterns
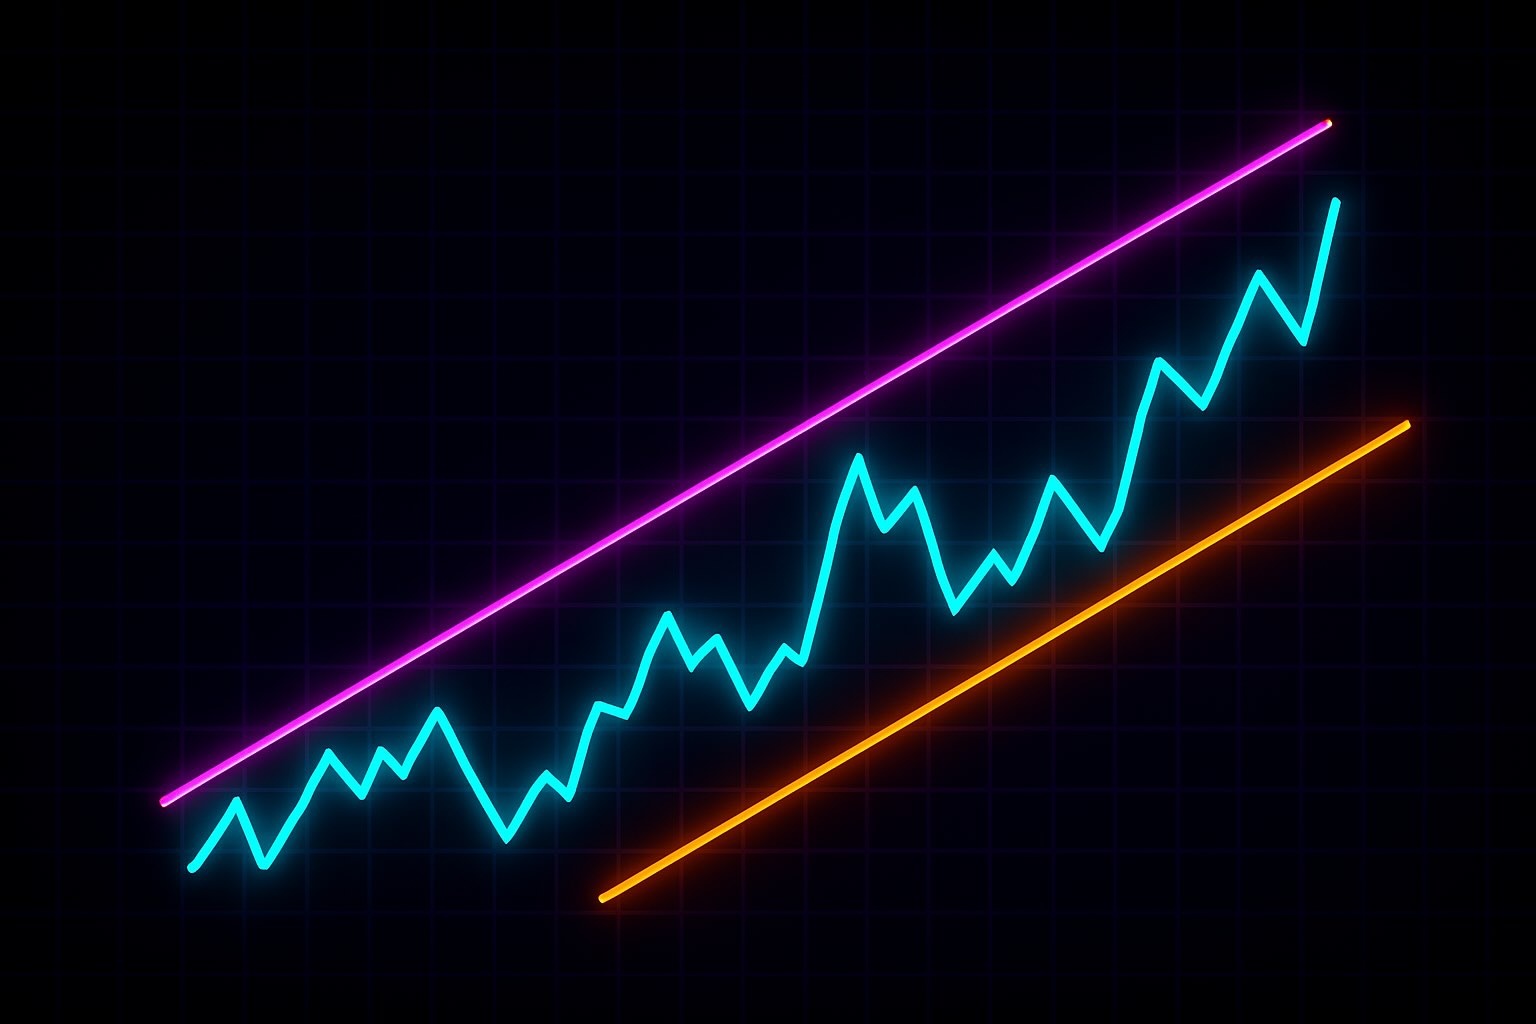
Trendlines
Follow the market’s path with clarity. Highlights direction, support, and when momentum may be about to shift.
Explore The How
Trendlines
Support, Resistance & Patterns
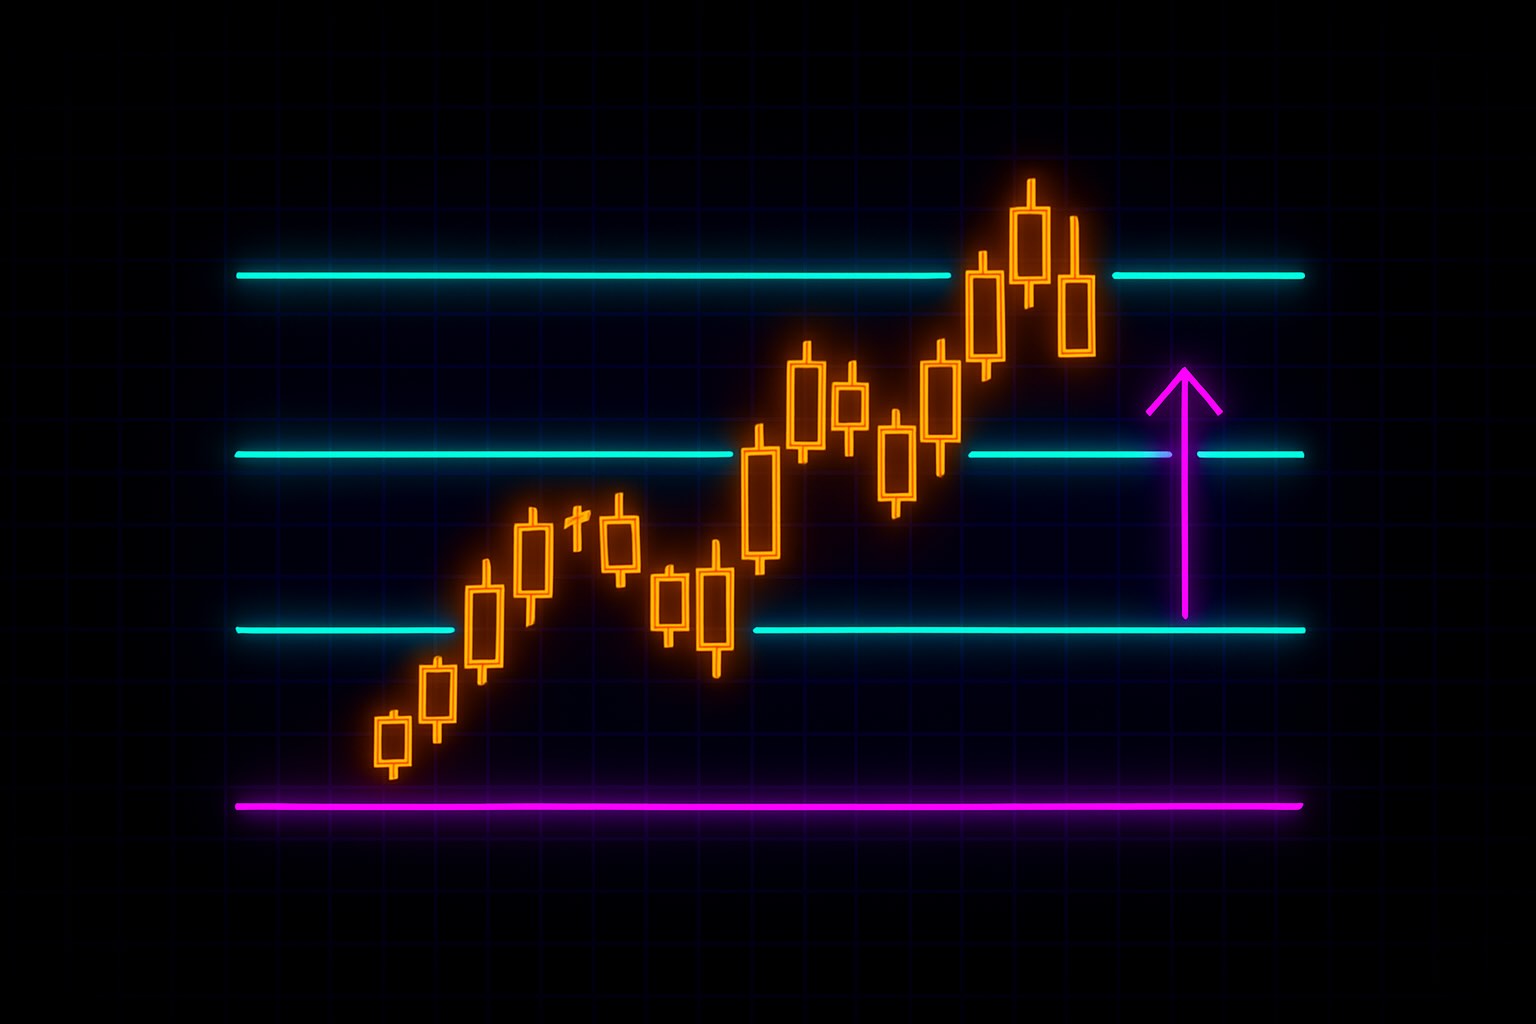
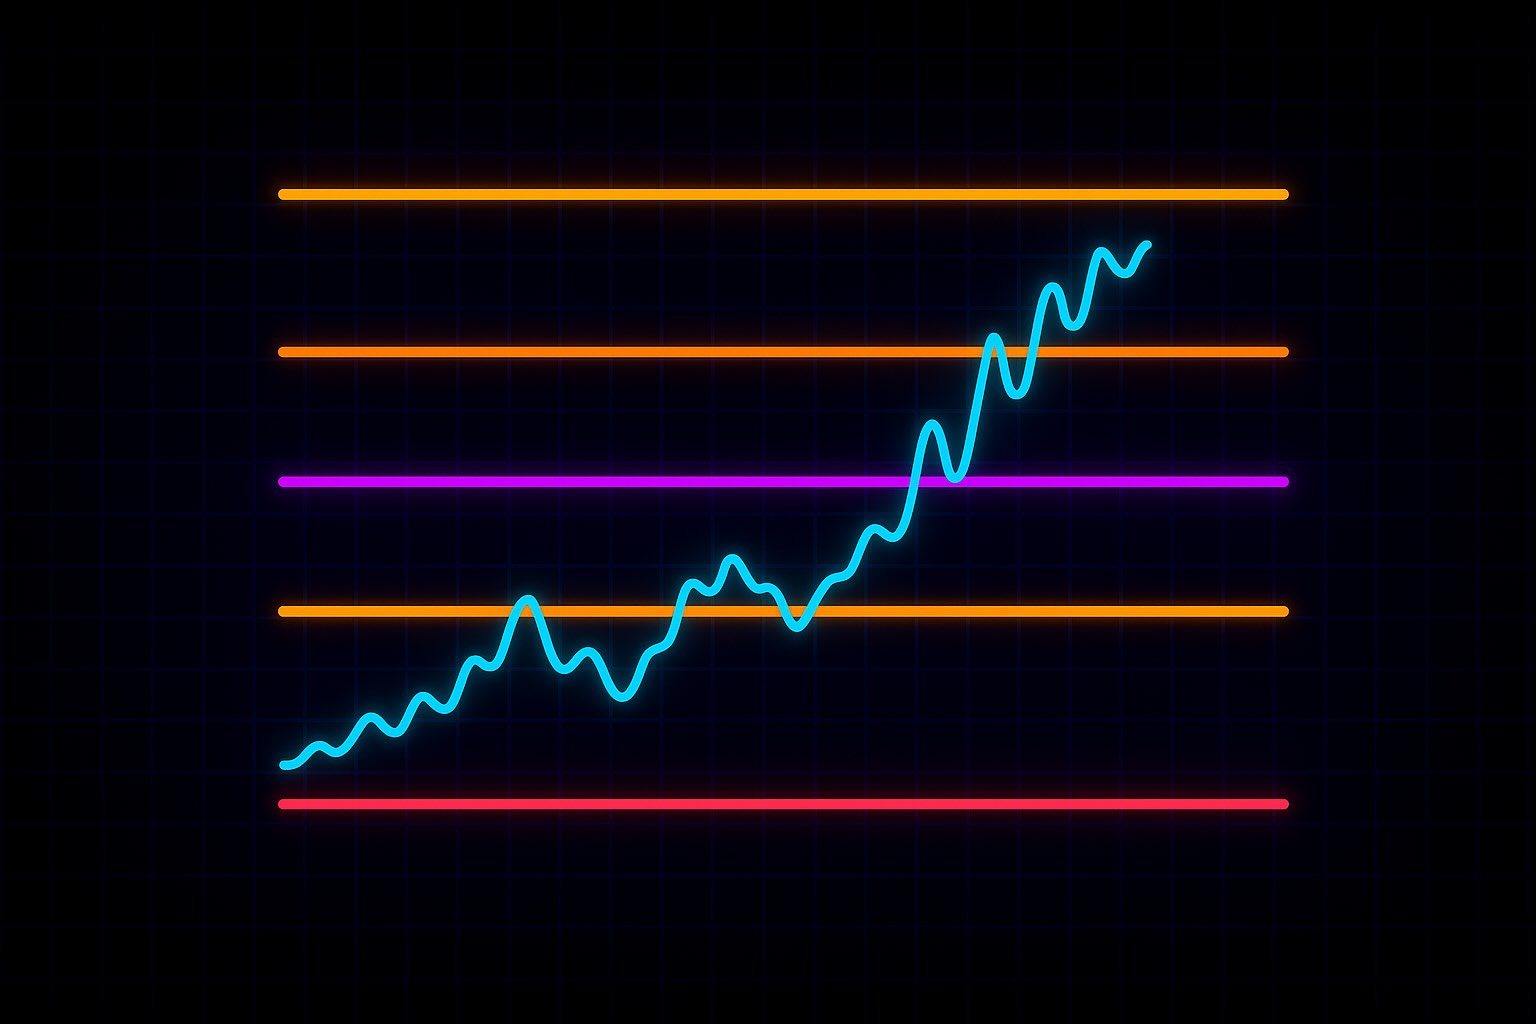
Pivot Points
Let previous price action guide the next. Highlights areas where the market may pause, bounce, or reverse.
Explore The How
Pivot Points
Support, Resistance & Patterns
Fibonacci Retracement
Use after strong price moves to spot likely pullbacks. Adds structure to exits — and removes the guesswork.
Explore The How
Fibonacci Retracement
Support, Resistance & Patterns
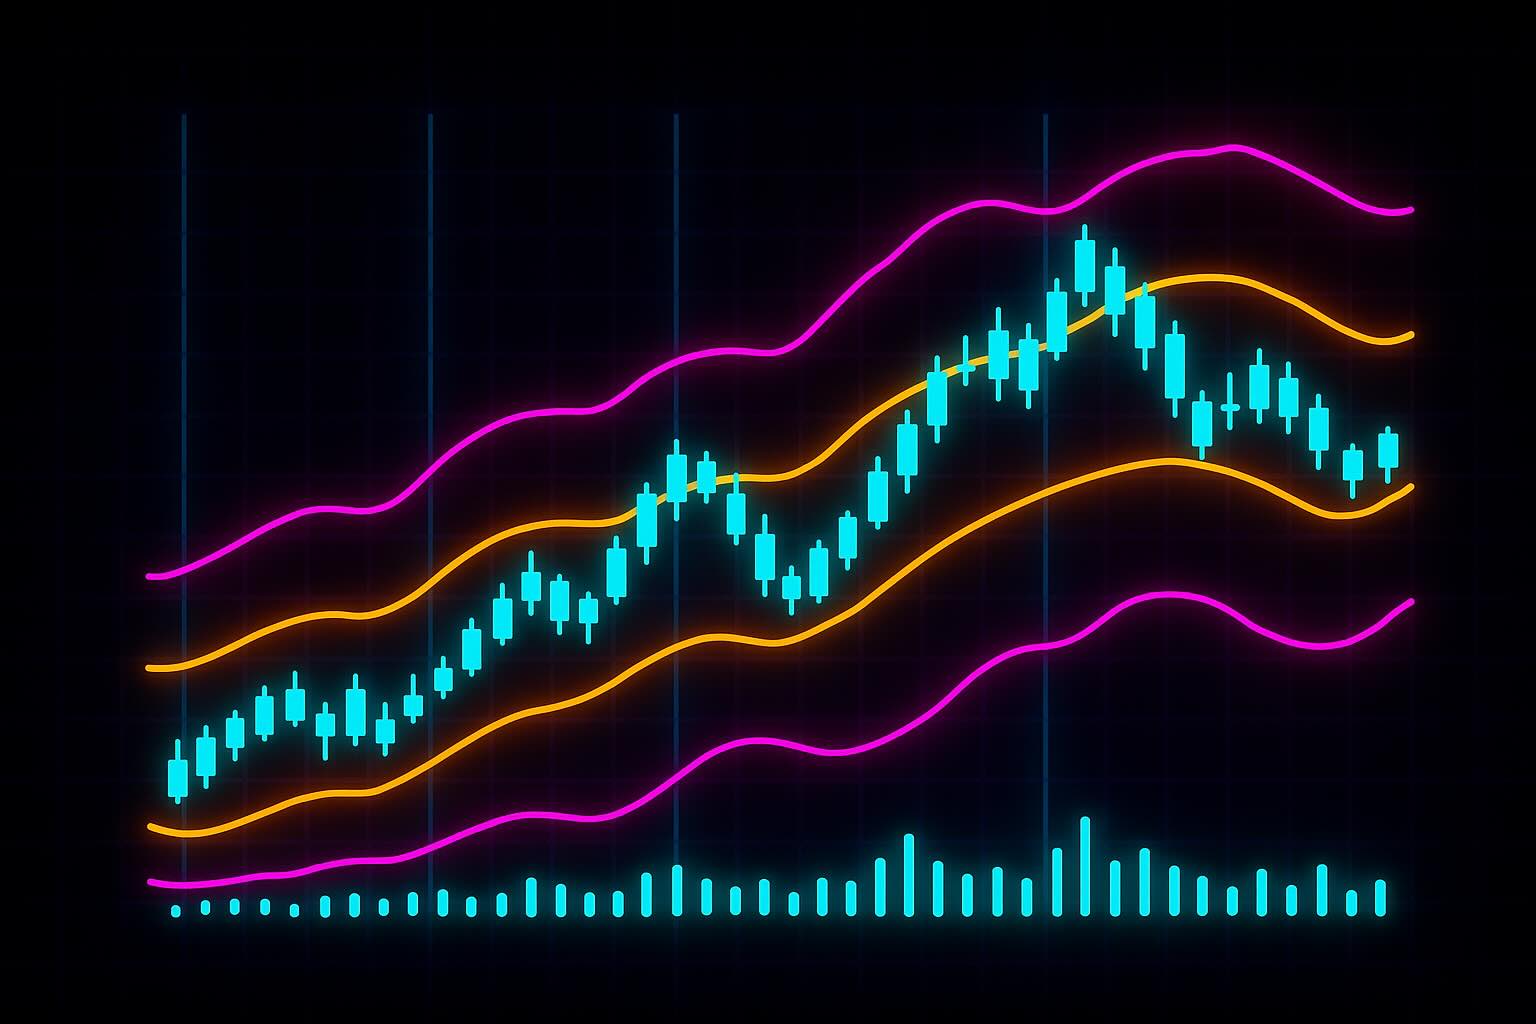
Ichimoku Cloud
See the trend, momentum, and key levels — all in one view. The cloud shows where price stands now, and what might lie ahead.
Explore The How
Ichimoku Cloud
Trend Analysis & Momentum