MACD tracks the relationship between speed and direction — and where they might be diverging.

Ever wonder if a trend still has strength — or if it’s already fading?
MACD helps you see that.
In this walkthrough, you’ll learn how to read momentum shifts using MACD’s lines and histogram, how to confirm whether a move has real power behind it, and how to avoid chasing trends that are already losing energy.
You won’t get buy or sell signals.
You’ll get something more valuable:
A way to understand if the pressure behind a move is building, stalling, or ready to reverse.
Let’s begin.
MACD stands for Moving Average Convergence Divergence — but at its core, it’s a way to observe how momentum is shifting within a trend.
It doesn’t try to predict tops or bottoms.
Instead, it helps you see when a trend is accelerating, stalling, or starting to reverse — not based on price alone, but on the strength behind the move.
MACD is built from moving averages. By comparing fast and slow averages, it shows how momentum expands, contracts, and crosses over key inflection points. These shifts often happen before price turns — or just as structure begins to break down.
MACD won’t give you precise entries or exits.
But it will tell you when pressure is building — or fading.
Used with structure, it can help confirm trades, spot divergences, and keep you out of late entries.
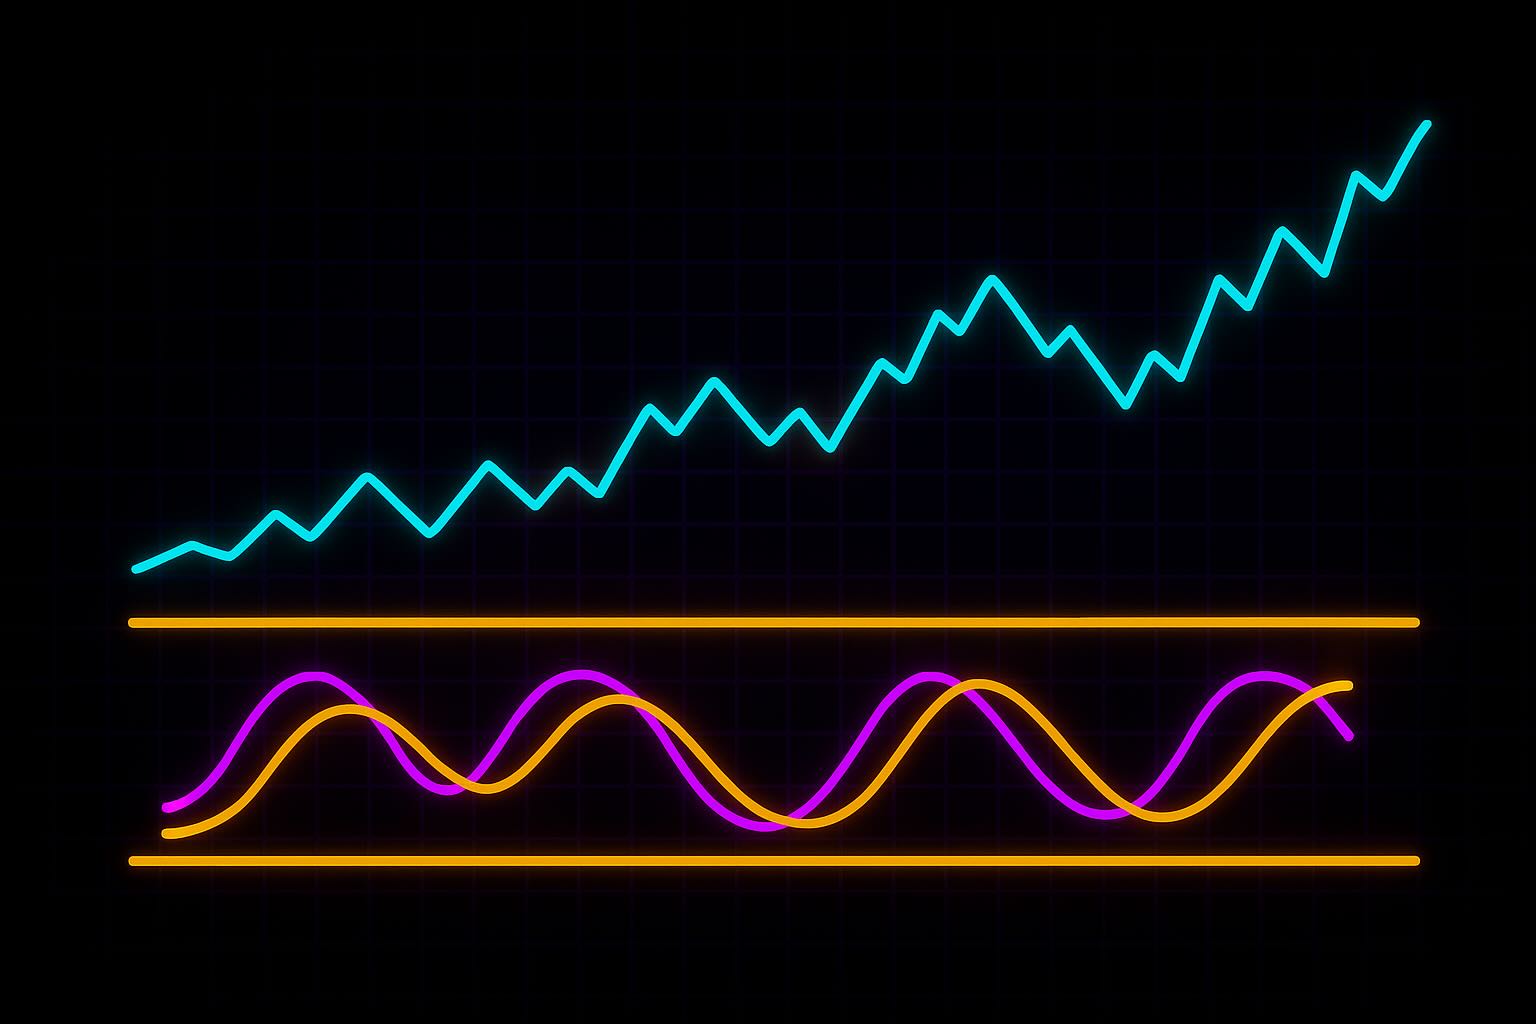
The MACD is made up of three key components:
1. The MACD Line
This line is the difference between a fast and a slow exponential moving average — typically the 12-period and 26-period EMAs.
When the MACD line rises, short-term momentum is outpacing the longer-term trend. When it falls, momentum is slowing or reversing.
2. The Signal Line
This is a 9-period EMA of the MACD line. It reacts more slowly and helps smooth out the signal.
When the MACD line crosses above the signal line, it suggests upward momentum is increasing. When it crosses below, it often signals a potential shift downward.
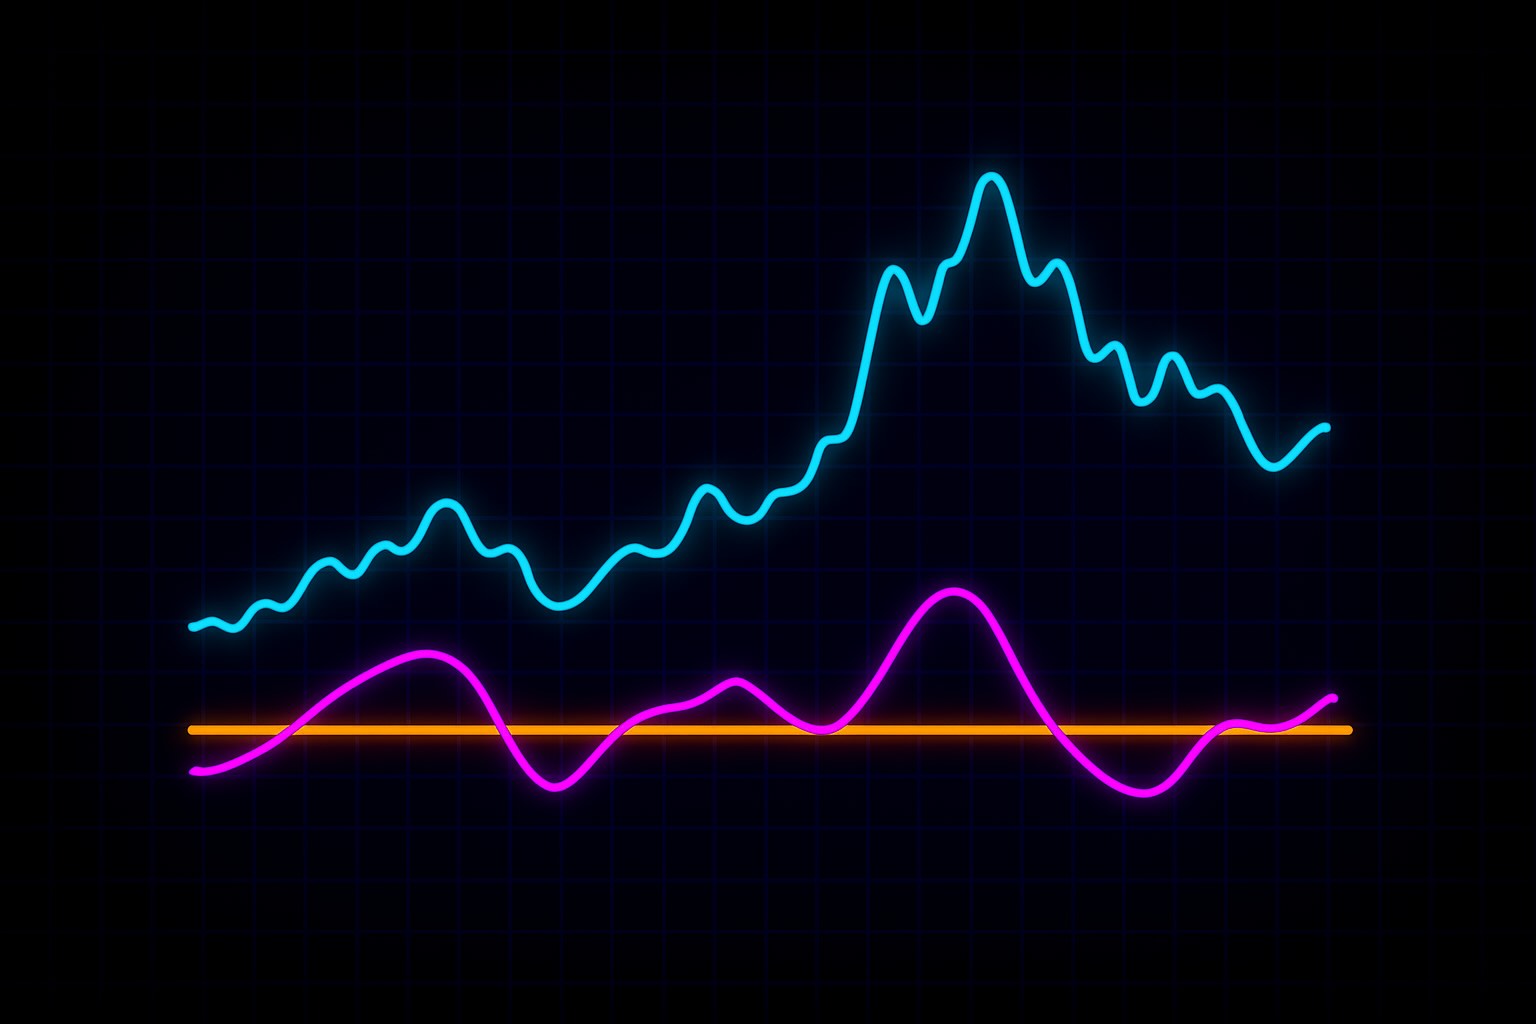
3. The Histogram
This shows the distance between the MACD line and the signal line.
A rising histogram reflects increasing momentum in the direction of the move. A shrinking histogram shows weakening force — even if price is still moving.
Together, these elements give you a visual map of momentum — not just direction, but strength and change over time.
MACD doesn’t track price directly.
It tracks the energy behind price — and how that energy changes.
MACD is most useful when you want to understand how momentum is behaving within an existing trend — whether that trend is gaining strength, losing steam, or preparing to shift.
You use MACD when:
It’s especially helpful during:
MACD works best on higher timeframes (1H and up), where momentum flows more cleanly.
On lower timeframes, it can be reactive — and should be paired with structure or volume.
Avoid using MACD in isolation.
Without price context, it can give early or false signals.
MACD doesn’t tell you when to enter.
It tells you when momentum is supporting the trade — or not.
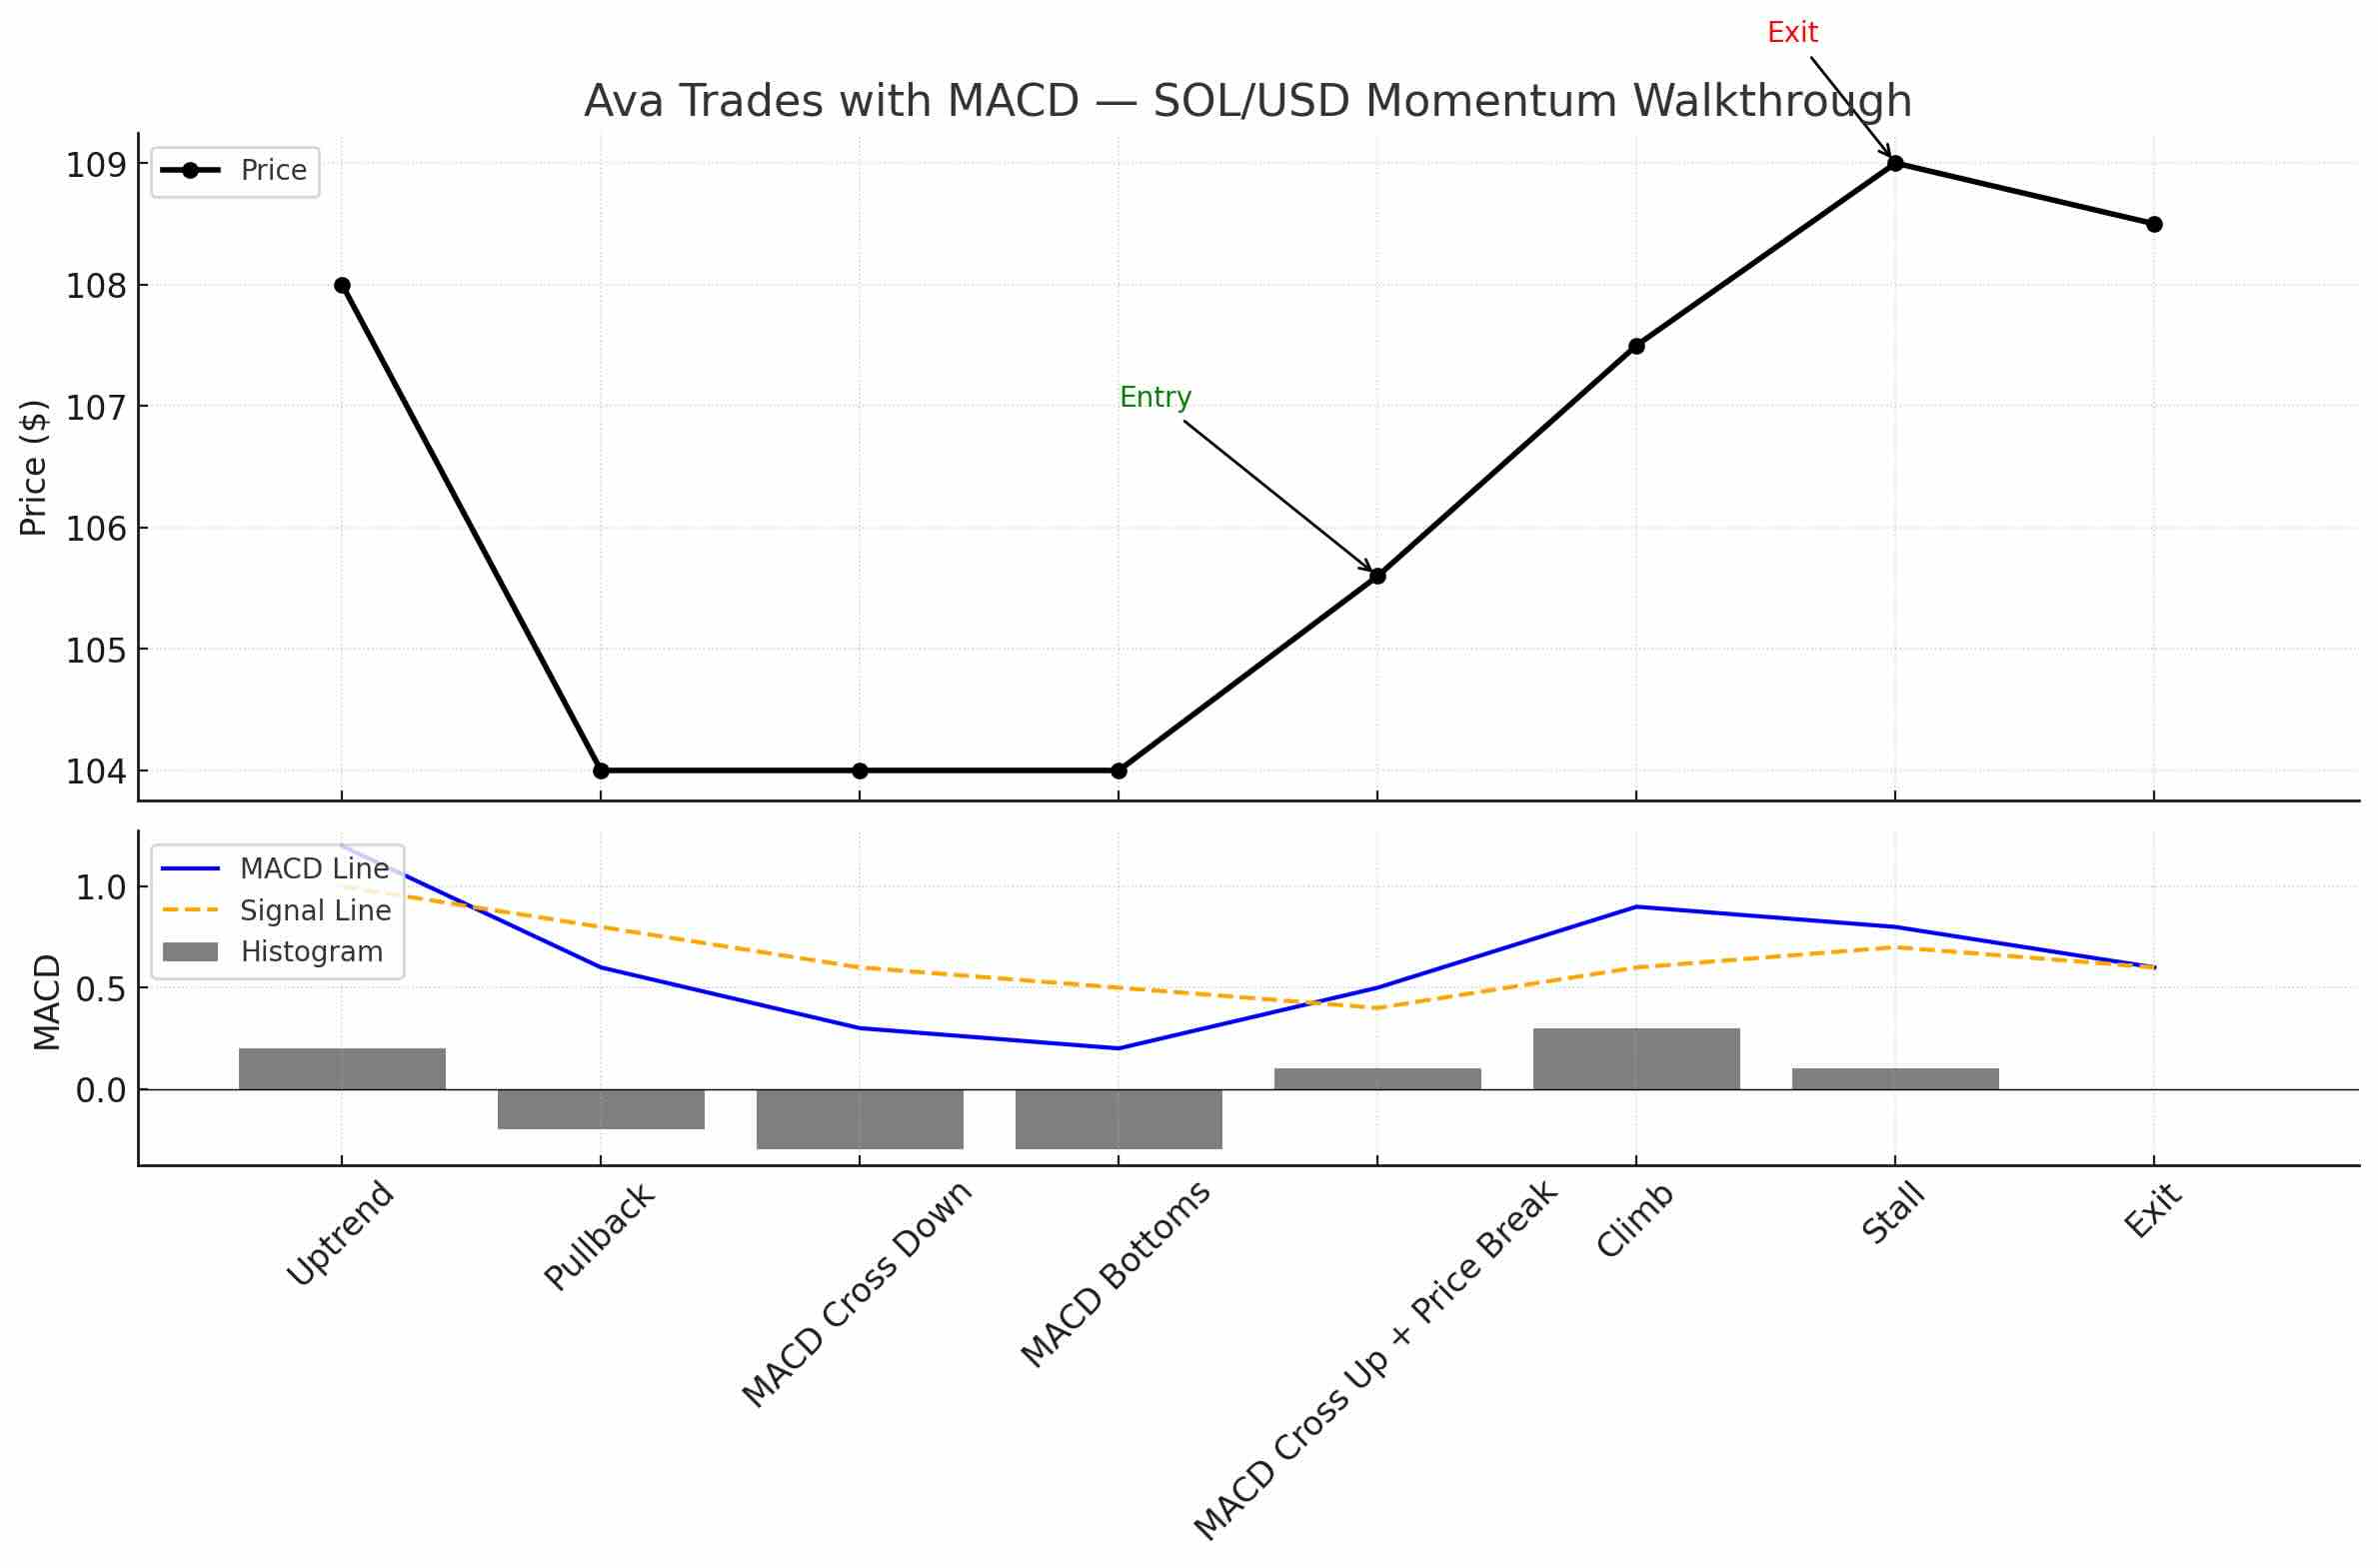
Let’s follow Ava — a trend-based trader who uses MACD to time her entries with the flow of momentum, not against it.
It’s Thursday. Solana (SOL) has been in a steady uptrend for days, pushing from $96 to $108 with small pullbacks along the way. Ava isn’t chasing the move — she’s watching for momentum to realign after a reset.
Price pulls back from $108 to $104. On the chart, structure is still intact — higher highs, higher lows — but Ava needs confirmation that the pullback is just a pause, not the start of a breakdown.
She opens the MACD panel.
This shows a temporary shift in momentum — a correction, not a collapse.
Over the next few candles, price begins to base around $104. The structure is still holding — and MACD begins to respond.
Ava waits for the MACD line to cross back above the signal line — and for price to close strong above the short-term resistance at $105.50.
When both happen, she enters long.
Her stop-loss is set below the recent low at $103.70.
Her target is a retest of the prior high at $108 — with room for more if momentum continues.
Over the next day, price climbs steadily. The MACD line stays above the signal line, and the histogram expands — confirming strength.
Ava stays in the trade until the histogram starts to flatten and price stalls near $109. That’s her cue to exit.
MACD didn’t tell her where to buy.
It told her when momentum returned — and helped her stay in the trade while it was building.
MACD isn’t about signals — it’s about reading the strength and direction of momentum. Ava doesn’t react to every cross or histogram bar. She reads how those shifts relate to structure and flow.
Here’s what she watches:
MACD doesn’t tell her what to do.
It helps her read how forceful the current move really is — and whether it’s gaining or losing energy.
Ava uses MACD as a momentum filter — not a trigger.
It helps her avoid emotional entries and stay aligned with strength, not against it.
She starts by checking the MACD line’s position relative to the zero line. If it’s above zero, she treats the trend as strong. Below zero, she assumes bearish pressure is in control — even if price is still rising temporarily.
Next, she checks the relationship between the MACD line and the signal line. A fresh crossover after a pullback means momentum may be returning. A cross after an extended move often signals a slowdown — not a fresh opportunity.
Then she looks at the histogram. Is it expanding? Flattening? Diverging from price? If it’s growing with price, the move is healthy. If price is rising but the histogram is shrinking, momentum may be failing — and Ava gets cautious.
She always pairs MACD with structure. If the MACD supports a breakout or a bounce from support, she’ll look for confirmation from volume or candles. If structure is clean but MACD is flat or lagging, she waits.
Divergence matters too — but only when it shows up at key zones.
MACD divergence without price structure is a warning.
Divergence at support or resistance is a signal to watch more closely.
MACD helps Ava avoid chasing — and keeps her out when the energy is gone.
It doesn’t give her trades.
It helps her decide when the trade has force behind it — and when it doesn’t.
MACD doesn’t tell you where price will go.
It shows you how momentum is behaving — and whether the current move has strength behind it or not.
At Kodex, we don’t use indicators to predict outcomes.
We use them to understand pressure, energy, and alignment.
MACD helps you frame trades with better timing.
It keeps you out when momentum is fading — and gives you confidence when it returns.
But like every tool, it only works in context.
Price gives you structure.
MACD gives you force.
And the trade lives where those two agree.
Let the momentum speak.
Let structure confirm it.
And let your decisions follow strength — not noise.