Every move has a motive. Volume shows you who’s behind it — and whether they mean it.
Price shows what’s happening.
Volume shows who’s behind it — and how committed they are.
In this walkthrough, you’ll learn how volume patterns reveal the intent behind each move, how Ava separates real strength from surface noise, and why energy matters more than direction alone.
You’ll see how volume confirms conviction, exposes hesitation, and helps you track when the market is truly aligned — or just drifting.
Because participation is structure.
And structure tells you what’s likely to hold.
Let’s begin.
Price shows you what the market is doing.
Volume helps you understand who’s participating — and how committed they are.
Volume patterns reveal the strength behind a move. They help you see when a breakout has real support, when a trend is losing energy, or when accumulation is quietly taking place beneath the surface.
Used well, volume is not a secondary indicator. It’s a filter for price action — helping you separate meaningful moves from noise.
It doesn’t tell you where price will go next.
It tells you whether the current move is likely to hold — or fail.
When volume is rising into a move, it often confirms strength.
When it fades during a breakout or trend, it can signal weakness — even when price appears to be in control.
That’s what makes volume patterns essential:
They show you how much conviction is behind the candle.
Volume doesn’t move price — but it shows how seriously the market takes a move when it happens.
Certain patterns repeat across timeframes and assets. Recognizing them helps you assess whether a breakout is likely to hold, whether a trend is gaining momentum, or whether a reversal might be forming.
Here are the most common volume behaviors Ava watches for:
1. Rising Volume with Price Movement
When price rises and volume rises with it, it suggests strong participation. Buyers are confident, and the move is being supported by activity. This is what Ava looks for in confirmed breakouts and strong trend continuations.
2. Falling Volume with Price Movement
If price continues to rise (or fall), but volume fades, that’s a warning. The move may still be happening — but with fewer participants. Ava treats this as a sign of weak commitment, especially near key resistance or support levels.
3. Spikes at Reversals or Breakouts
Sudden volume surges can mean capitulation (the end of a move) or confirmation (a fresh breakout). Ava always checks what the candle looks like during the spike. A volume surge with a failed breakout often signals exhaustion. A surge with a strong close can confirm intent.
4. Volume Clusters During Consolidation
When volume stays elevated during sideways movement, it often signals accumulation (before a breakout) or distribution (before a breakdown). Ava watches how volume shifts as the range narrows — and prepares for the release.
5. Quiet Pullbacks, Strong Resumptions
In uptrends, Ava looks for low volume pullbacks followed by high volume pushes. That pattern tells her that the correction wasn’t aggressive — and buyers still control the market. The same logic applies in reverse for downtrends.
These aren’t fixed rules — they’re signals of behavior.
The goal isn’t to interpret every spike. It’s to understand what the market is doing with energy — and what it’s doing without it.
Volume is always present — but it becomes most useful when you're asking,
“Is this move real, or is it running on fumes?”
You use volume patterns when:
Volume becomes especially important in moments of transition:
But volume should never be used in isolation.
It’s most effective when combined with:
If volume confirms what price is suggesting, Ava pays attention.
If price is moving without participation — she steps back.
The move might still happen — but without volume, it’s running on borrowed energy.
Volume doesn’t predict.
It confirms whether market participation is aligned with the move.
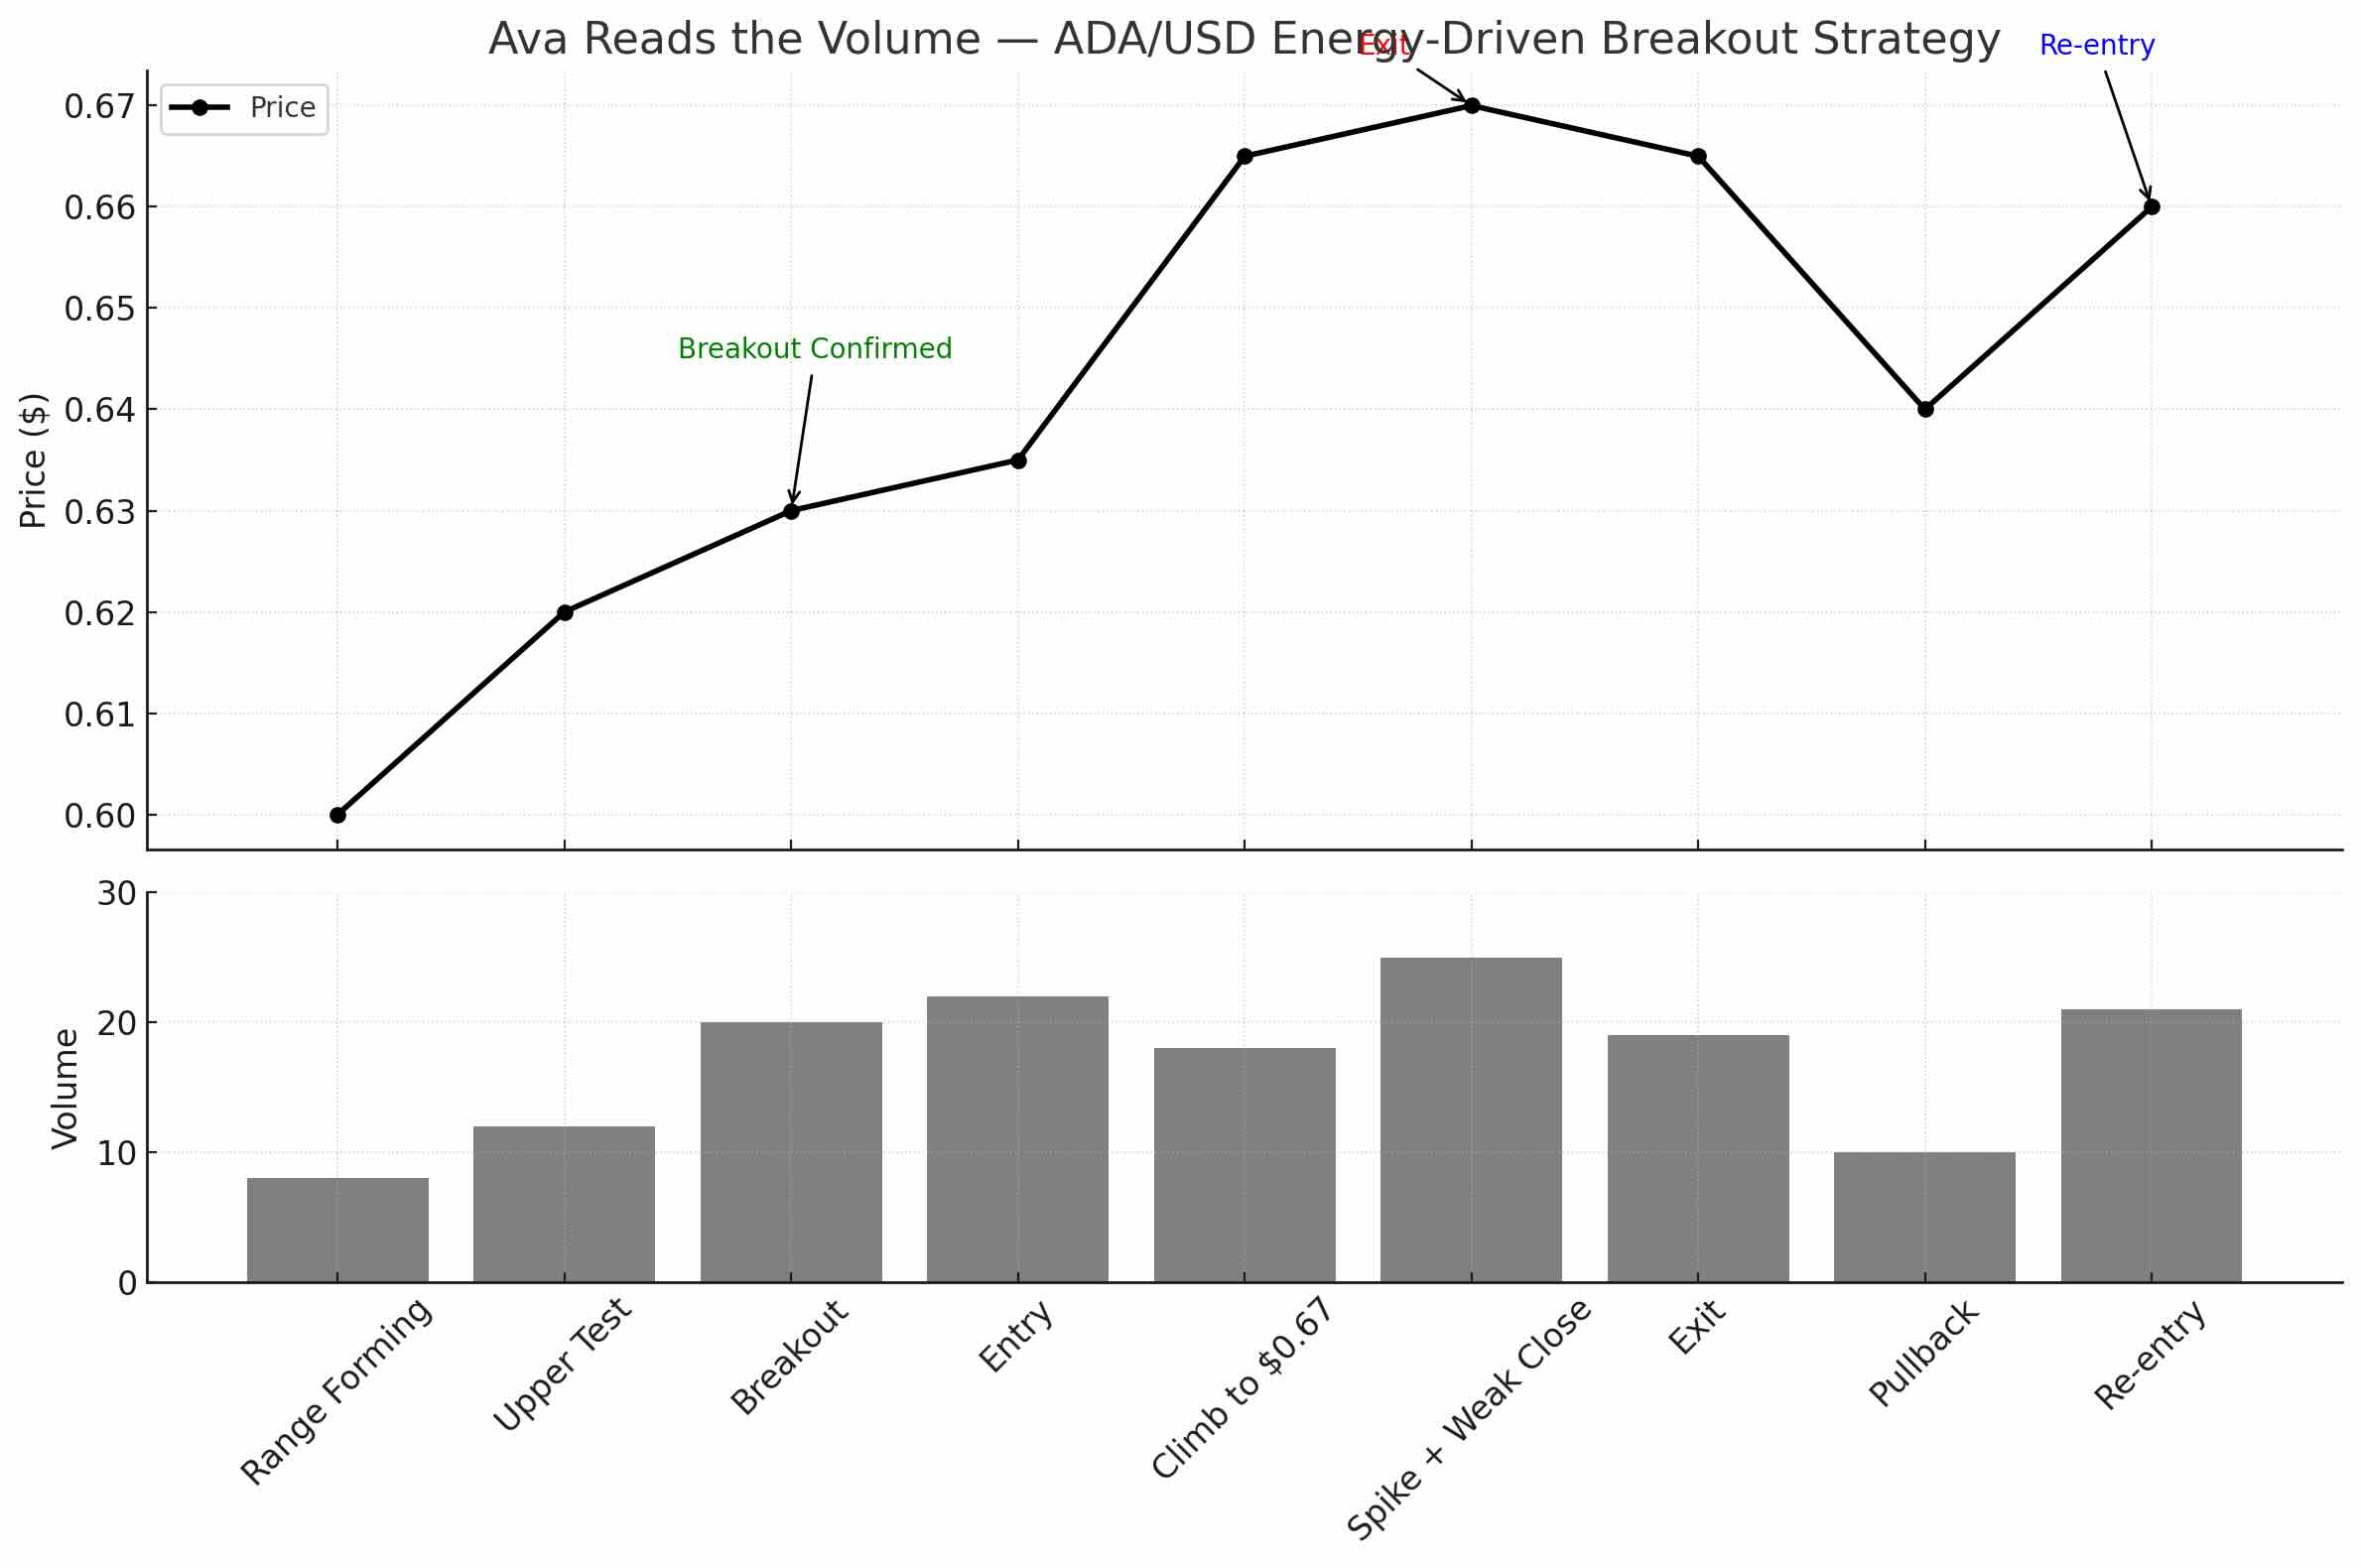
Let’s follow Ava as she analyzes a potential breakout in Cardano (ADA).
The price has been consolidating for several days between $0.58 and $0.62. The candles are getting tighter. Volatility is shrinking. Ava sees the structure forming — a clear horizontal range — but she doesn’t act yet.
She watches the volume.
Each time price touches the lower bound ($0.58), volume stays low. No panic, no exit. But when price pushes toward the upper edge at $0.62, volume starts to rise — especially on green candles. That shift tells her something: buyers are starting to engage. Energy is building.
Then one afternoon, price breaks above $0.62.
Ava doesn’t chase the breakout on the candle alone. She checks the volume.
It’s higher than average — not extreme, but clearly elevated. The breakout candle closes strong, with little wick and follow-through into the next bar.
That’s enough confirmation.
She enters long.
Her stop is just below the former resistance at $0.62 — now acting as support.
Her target is the next logical resistance zone — $0.67 — where the last breakdown occurred.
As price climbs, volume remains steady. But when ADA nears $0.67, Ava sees a shift:
Volume spikes — but the candle closes weak, with a long upper wick.
That’s a sign of possible exhaustion. Ava exits the position.
Later, ADA pulls back. The correction is clean — price drops to $0.64, but volume is light.
No panic. No reversal signal.
When volume increases again on the next move up, Ava re-enters — now with a stronger base and renewed conviction.
She didn’t just follow price.
She tracked energy — and used volume to stay in sync with what the market was willing to support.
Volume doesn’t give answers — it gives context.
Ava doesn’t just look at whether volume is “high” or “low.” She compares it to the moment. What’s happening in price — and what is volume telling her about the conviction behind that move?
Here’s how she breaks it down:
It’s not about reacting to every spike.
It’s about recognizing whether volume supports what price is trying to do — or contradicts it.
If they agree, she prepares.
If they diverge, she stays out.
Ava never looks at volume in isolation.
She always starts with the question: What is price doing — and how committed is the market to that move?
When a trend begins, she checks if volume is rising with it. If it is, that tells her buyers (or sellers) are engaged — the move has participation. If price moves without volume, she doesn’t ignore it, but she treats it with caution. Momentum without energy rarely lasts.
Before trading a breakout, Ava looks for buildup.
She wants to see volume gradually increasing as price approaches a key level. She doesn’t chase the breakout itself — she waits to see if volume confirms that the breakout has real backing.
During pullbacks, she pays close attention to volume behavior.
A quiet pullback often means the trend is still in control.
But a pullback with a sudden spike? That could be a warning. Something’s shifting.
When consolidations drag on, she looks for quiet volume followed by a clean surge on the break.
If the break happens without volume — she waits. If volume explodes, but price fails to hold — she doesn’t trust it.
Most of all, Ava treats volume as a way to measure conviction.
Not every move needs high volume.
But if there’s no interest behind a move — she won’t force a trade.
Volume helps her stay aligned with participation — and avoid acting on price alone.
Volume doesn’t forecast direction.
It tells you how seriously the market takes the move you’re seeing.
Used with structure, it gives you confidence. It helps you avoid chasing weak breakouts, recognize healthy pullbacks, and stay alert to exhaustion before it becomes obvious.
At Kodex, we don’t trade price alone.
We want to know who’s behind the move — and whether they’re still there.
When price aligns with volume, we pay attention.
When it doesn’t, we wait.
Volume patterns won’t give you certainty.
But they will give you a deeper read on market intent — and a clearer sense of when participation supports your plan.
Let price set the stage.
Let volume confirm the engagement.
And let behavior — not pressure — guide your decision.