These levels won’t move for you — but they will help you prepare. Pivot Points ground you in reference before volatility unfolds.
In this walkthrough, you’ll learn how to:
This isn’t about predicting direction.
It’s about being ready — wherever price goes next.
Because when you know the map, you don’t chase the move.
You let the market come to you.
Let’s begin.
Markets rarely move in a straight line. They rotate. They move up, down, and often return to familiar zones. This back-and-forth motion is part of how price finds balance — and Pivot Points are designed to help you track it.
Pivot Points are a set of levels based on the previous session’s high, low, and close. These levels are used to mark areas where price may react — acting as potential support, resistance, or decision points in the current session.
They don’t predict direction.
They help you prepare for where reactions might occur.
What makes them useful is:
But it’s not about the levels themselves.
It’s about how price behaves when it gets there.
Pivot Points begin with one central level: the Pivot (P).
It’s calculated as the average of the previous session’s high, low, and close. This level often acts like a midpoint — a reference around which price may rotate or rebalance during the next session.
From this center, three support levels and three resistance levels are projected:
All Pivot levels are fixed for the session — they don’t move like a moving average.
This gives you something stable to work from — even as the market itself moves constantly.
But knowing the levels is just the starting point.
The real skill is in reading what happens when price reaches them.
Pivot Points are most useful when you’re trading short timeframes — such as 15-minute, 1-hour, or 4-hour charts. They help you pre-mark areas of interest before the session starts, so you don’t need to make decisions in the heat of the moment.
You might use Pivot Points to frame a trade setup, define a potential entry or target zone, or place a logical stop based on structure rather than emotion.
They work best in steady, active sessions — when the market is moving with purpose, but not reacting wildly to unexpected news. This gives price room to move cleanly between levels and test them with visible behavior.
For best results, Pivot Points should be combined with other tools:
What matters most is how price interacts with the levels.
If you see clean reactions, hesitation, or clear break-and-retest behavior — that’s structure forming.
If price slices through multiple levels without slowing down — step back. On that day, the map isn’t being followed.
Like every tool in your system, Pivot Points are a guide — not a rule.
Let price tell you which levels matter.
Let’s follow Ava — an intraday trader who relies on structure, not guesswork.
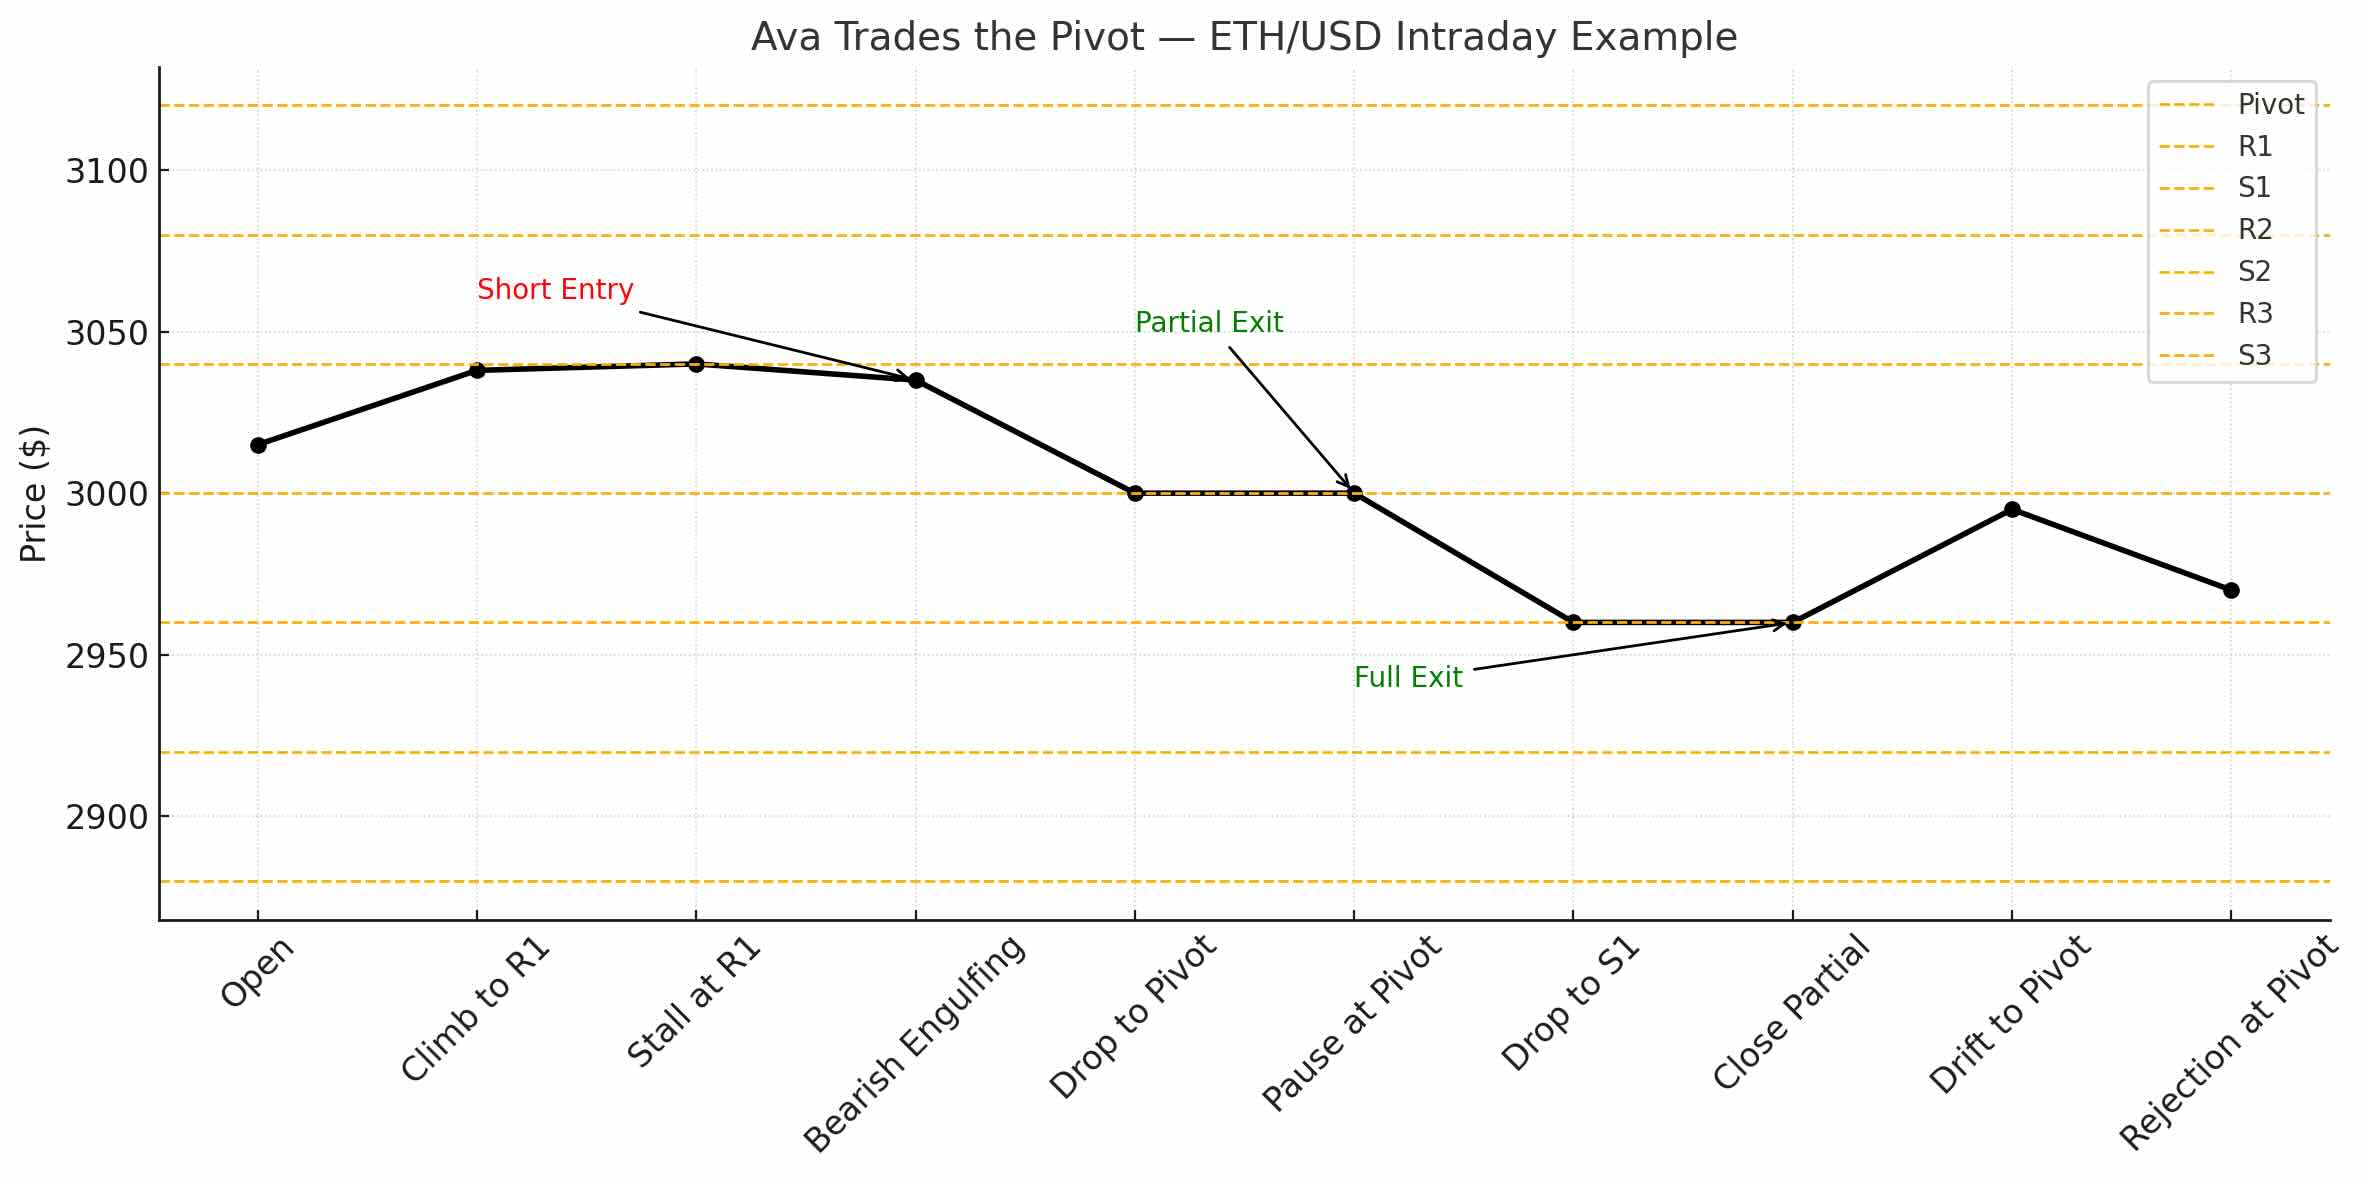
It’s Tuesday morning. Ethereum has been volatile, but overall range-bound. Monday’s session closed with a high of $3,060, a low of $2,940, and a close at $3,000.
Her chart now auto-generates the following Pivot Point levels:
The new session opens at $3,015 — slightly above the Pivot. Ava notes that price is sitting near the center of yesterday’s range. There’s no immediate trend bias, so she marks her opening stance as neutral. She’s watching for structure to form.
As the morning unfolds, price begins to climb toward R1 at $3,040. Ava watches carefully.
Volume increases — the market is active — but momentum doesn’t follow through. Candles begin to stall. Bodies get smaller. Upper wicks start to appear. There’s hesitation, not conviction.
She notices something else: R1 overlaps with Friday’s high — a zone where price had previously been rejected. That adds confluence. This isn’t just a calculated level — it’s a place with memory.
No breakout. No reversal yet. Just pressure building.
Then a bearish engulfing candle forms — closing below the previous two candles. That’s the shift Ava’s been waiting for.
She enters short — not because price touched a level, but because it reacted to it. Her stop-loss is placed just above R1. If price pushes through and holds, she knows the structure has changed.
Her initial target is the Pivot at $3,000 — the midpoint and likely reaction zone. Price pulls back, pauses there, and eventually continues to S1 at $2,960.
Ava closes part of the trade at the Pivot, and the rest as price reaches S1. Clean structure. No need to force it.
Later in the session, ETH drifts back toward the Pivot — this time from below. It retests the level, fails to reclaim it, and drops again.
That confirms something important: the structure has flipped. What was support earlier in the day is now acting as resistance.
Ava didn’t guess. She didn’t try to catch the top.
She waited for a level to be tested. She observed the behavior.
Then she acted — with confirmation.
Pivot Points are helpful not because they have special power — but because many traders are watching them. That collective attention often turns them into self-reinforcing zones of behavior.
But the levels only matter if price respects them.
And respect shows up through how price reacts.
When price approaches a Pivot level, Ava doesn’t focus on whether it touches it. She focuses on what happens next.
She asks:
Each of these questions helps her decide whether the market is respecting the level — or passing through it without care.
If price approaches slowly, stalls, and wicks begin to form — that’s often a sign of rejection.
If price moves through with force, then pulls back and holds — that’s a confirmed breakout.
If price slices through multiple levels without reacting — Ava steps back. That means today’s structure isn’t holding.
No tool works all the time. The key is not drawing the levels.
It’s watching how price responds when it meets them.
Pivot Points are simple in theory — but powerful when used with structure and discipline.
They help you enter the session with a plan. You know the key levels. You know where reactions are likely. And you’re no longer trading in the dark.
But the levels alone aren’t enough.
Structure gives you the framework.
Behavior is what makes it tradable.
At Kodex, we don’t rely on any single tool.
We prepare with structure. We observe with intent.
And we act only when both come together.
Use Pivot Points to guide your preparation.
Let price action confirm your plan.
And let structure — not emotion — shape your decisions.