ATR tells you how deeply the market inhales — and how wide the swings could get.

In this walkthrough, you’ll learn what ATR is, how it measures volatility, and how to use it to size your trades, set better stops, and avoid guessing in unstable conditions.
Because a setup isn’t just about direction.
It’s about knowing your limits — before the market shows them to you.
Let’s begin.
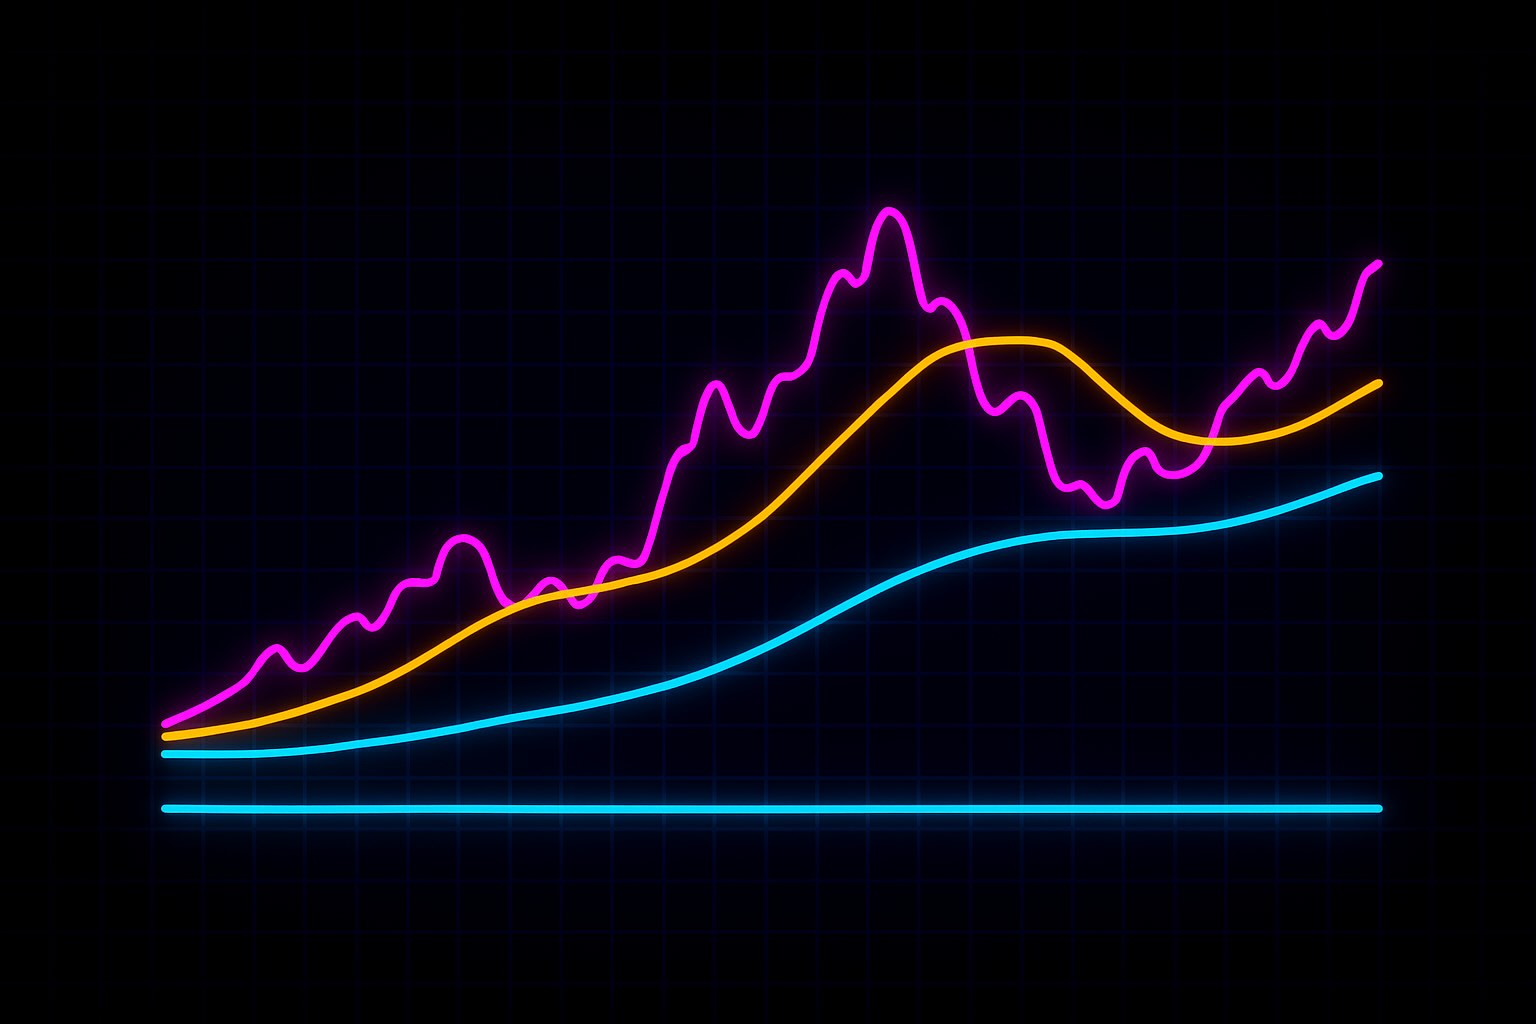
Markets don’t just move — they expand and contract.
Some days are quiet, with tight ranges and low momentum. Other days are explosive.
The challenge isn’t just knowing where price is going — it’s knowing how much it can reasonably move.
The Average True Range (ATR) helps you measure that.
It’s a volatility indicator — not a trend tool. ATR doesn’t care whether price is going up or down. It shows you how much price has been moving, on average, over a set period of time.
When ATR is high, the market is moving fast — often with wider candles and stronger emotion.
When ATR is low, movement is limited — structure may be tight, and breakouts may stall.
ATR doesn’t give entry signals.
It gives context — helping you size positions, set realistic stops, and avoid overreaching in calm or chaotic conditions.
Used correctly, it helps you respect the nature of the current market — not the one you wish you were in.
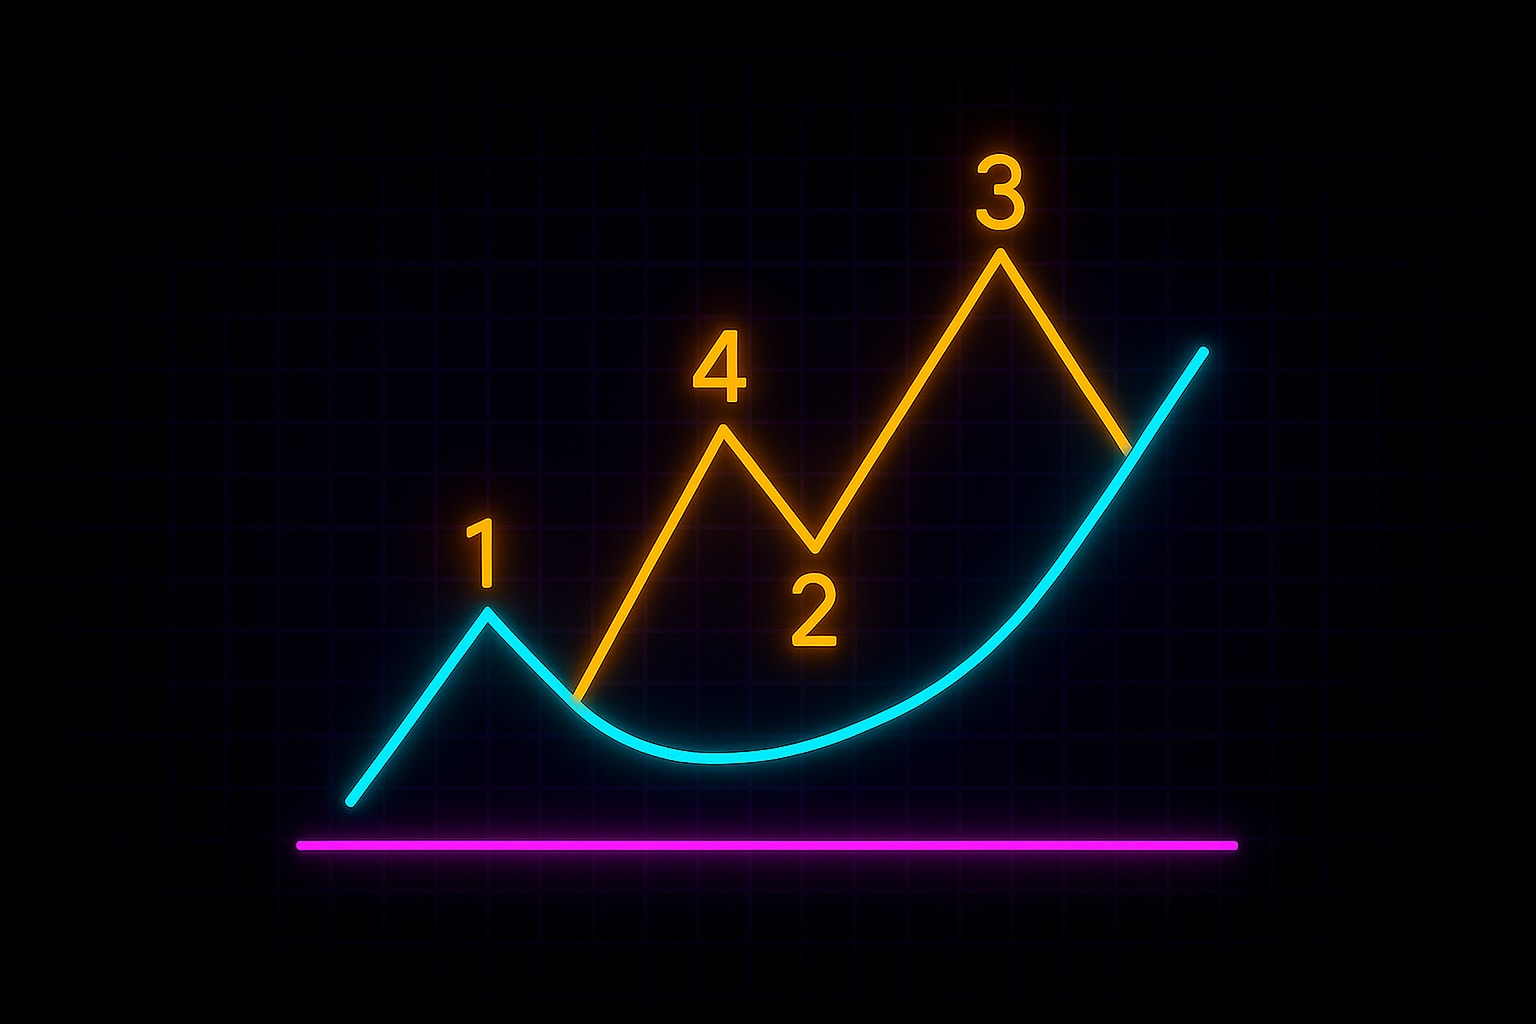
ATR measures the average range between highs and lows — including gaps — over a set period. It’s typically calculated using a 14-period setting.
At each candle, it looks at the True Range — the greatest of:
This makes sure sudden gaps, spikes, and breakaway moves are accounted for — not just the candle body.
The result is then averaged over time.
The line that forms — the ATR — reflects how much price has been moving, regardless of direction.
The ATR doesn’t tell you where price is going.
It tells you how far it’s likely to move once it does.
For Ava, it’s not a signal — it’s a constraint. A way to measure risk, adapt position size, and recognize when a market is overheated… or just not ready to move yet.
ATR is most useful when you need to adjust to the speed of the market.
It doesn’t tell you when to enter — but it helps you decide how to size your position, where to place your stop, and whether the current environment supports your strategy.
Ava uses ATR when:
ATR is especially helpful when:
It’s less effective when:
ATR works best when you let it do what it’s meant for:
Help you stay within the limits of the market’s current energy.
Let’s follow Ava — a trader who adjusts her strategy based on market conditions, not assumptions.
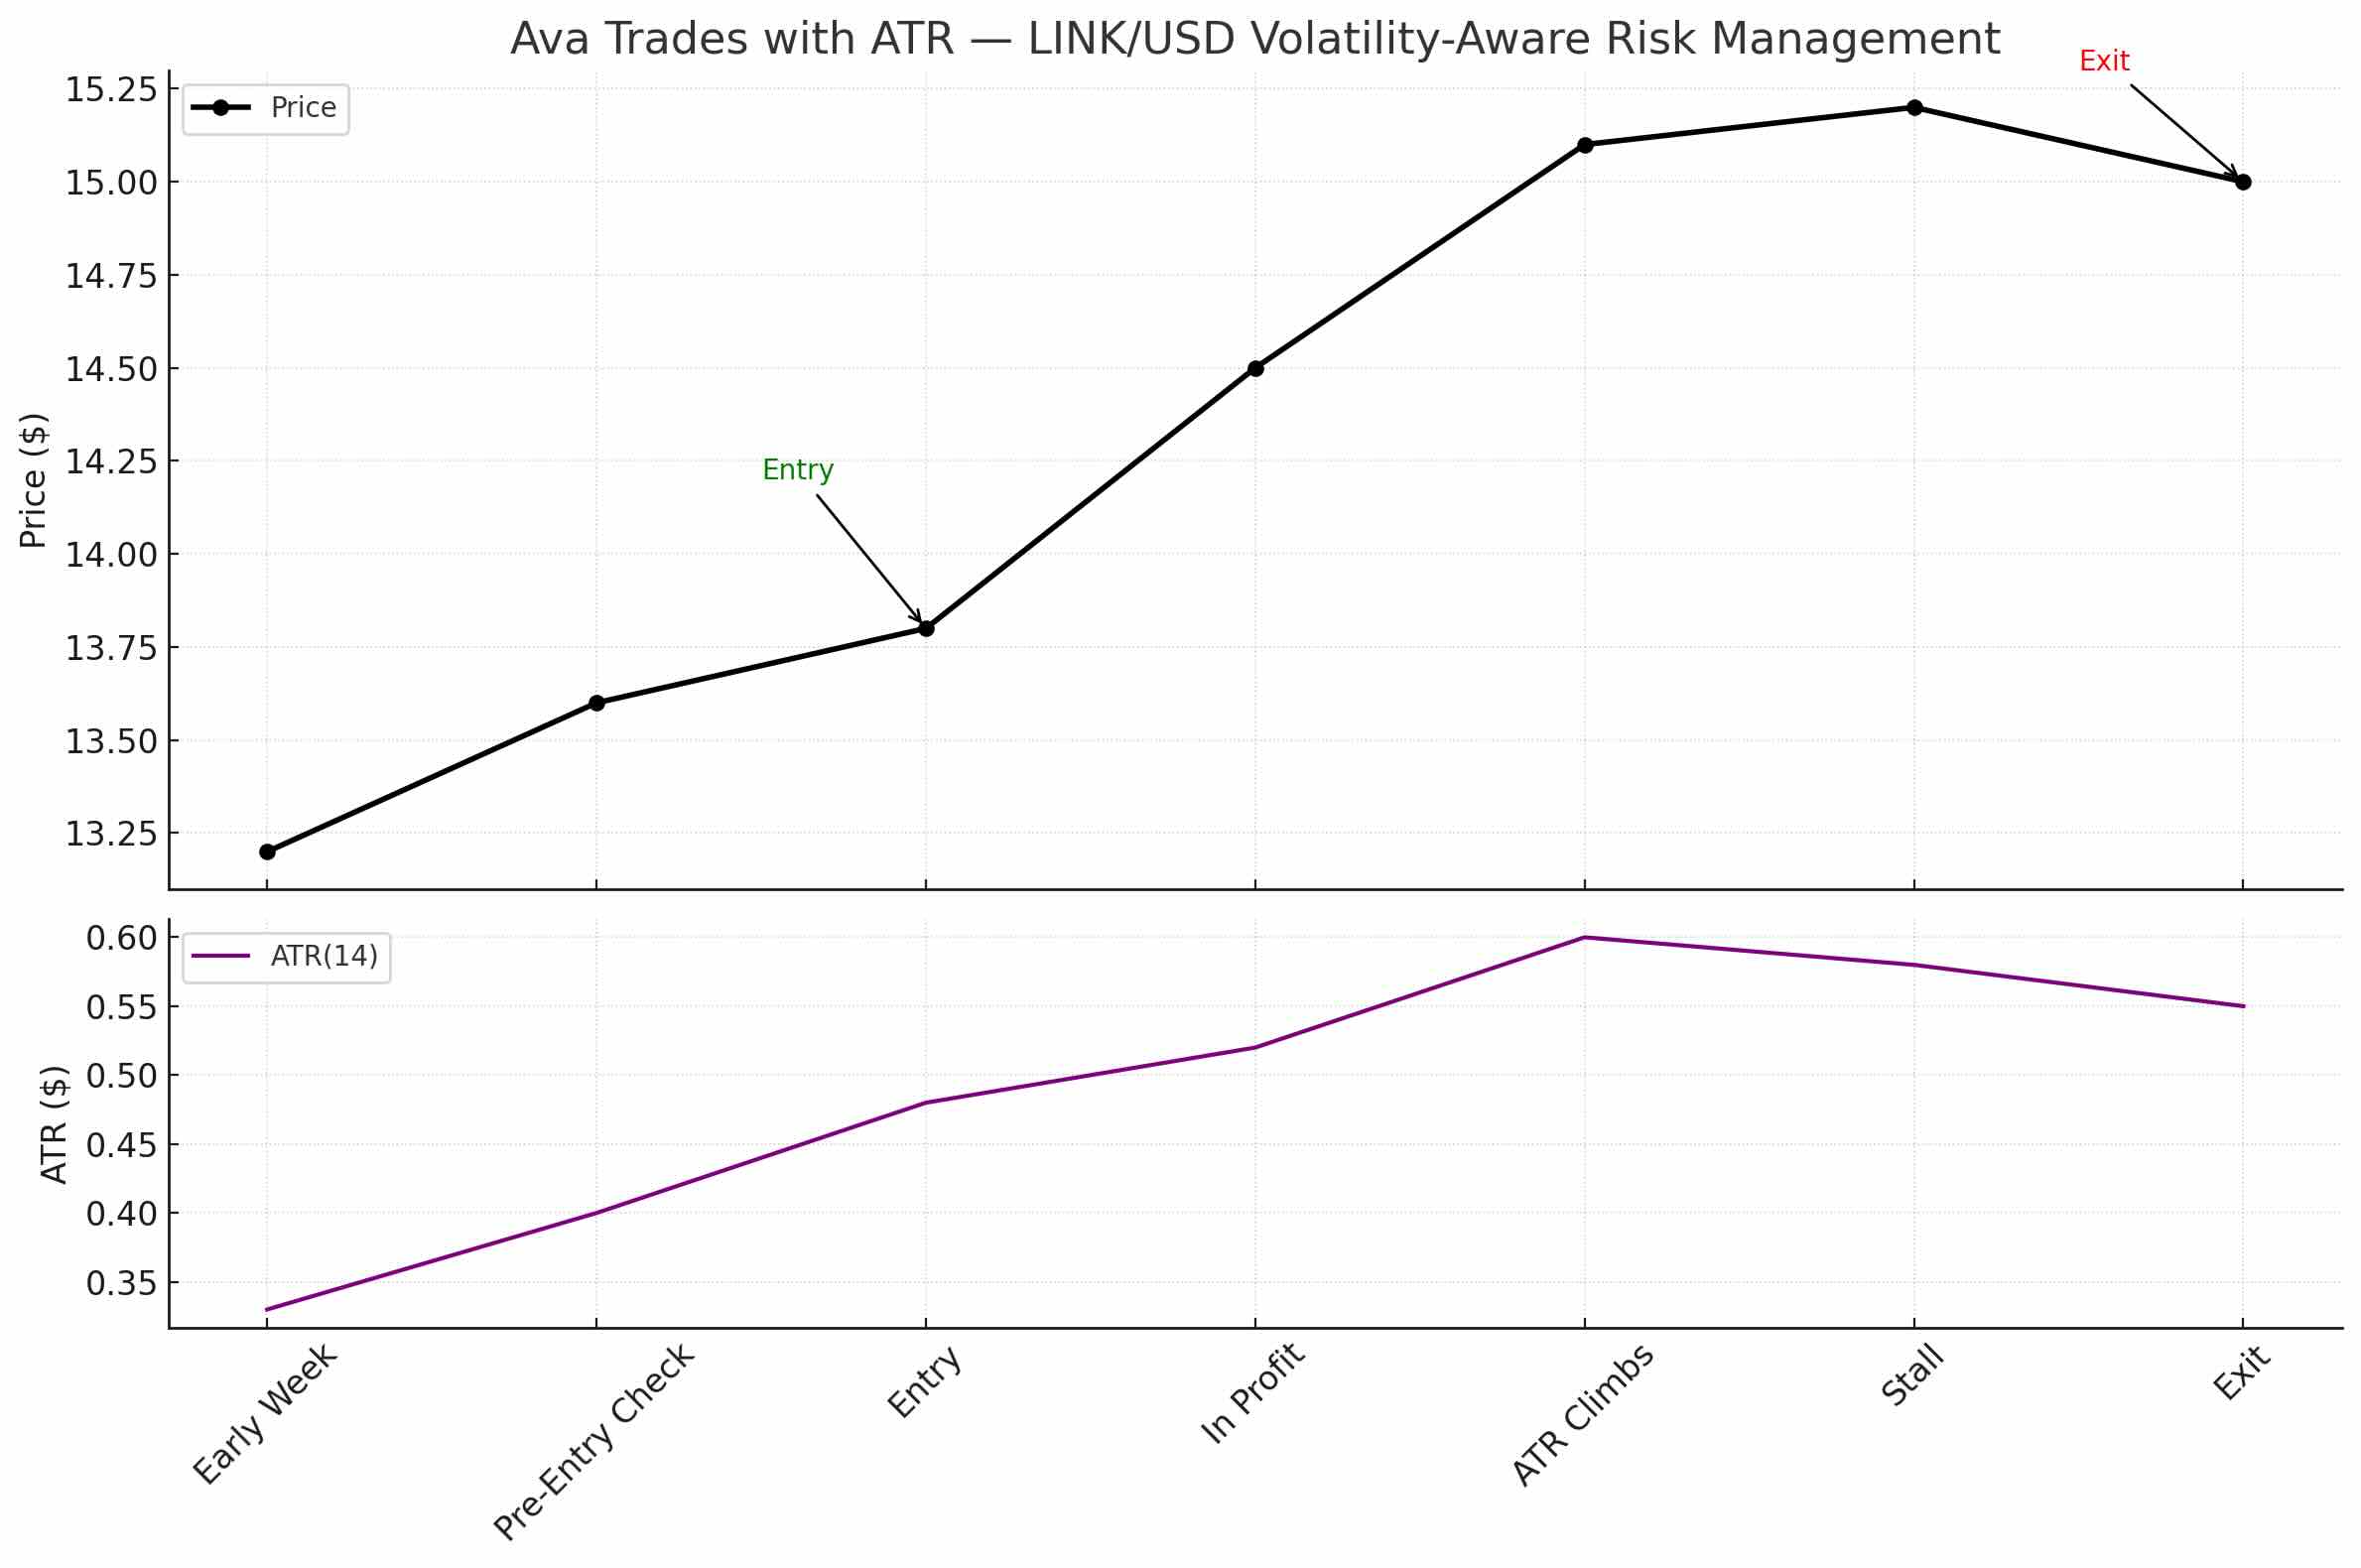
It’s Thursday morning, and Ava is tracking Chainlink (LINK), which has been climbing steadily for three sessions. The structure is clean, and momentum is still strong — but before entering, Ava wants to know what kind of volatility she’s stepping into.
She checks the ATR(14) on the 1-hour chart.
It’s currently reading $0.48 — up from $0.33 two days ago.
That means the average candle range has expanded by nearly 50%. The market is heating up.
Ava doesn’t rush the entry. She waits for a pullback to a key support zone. When price tags the level and prints a bullish engulfing candle, she enters long.
But instead of placing a fixed $0.20 stop like she used to, she now uses ATR to guide it.
This keeps her risk aligned with what the market is realistically capable of — not a guess.
As the trade unfolds, price moves in her favor — but quickly. By the time LINK gains $1.30, the ATR has jumped again, now nearing $0.60. Ava trails her stop just outside 1x ATR, giving the trade space while protecting the win.
Eventually, price stalls. Momentum slows. She exits the trade as ATR begins to flatten — not because she saw a signal, but because the energy behind the move was clearly fading.
Ava didn’t use ATR to time the trade.
She used it to frame the risk and adapt as the environment changed.
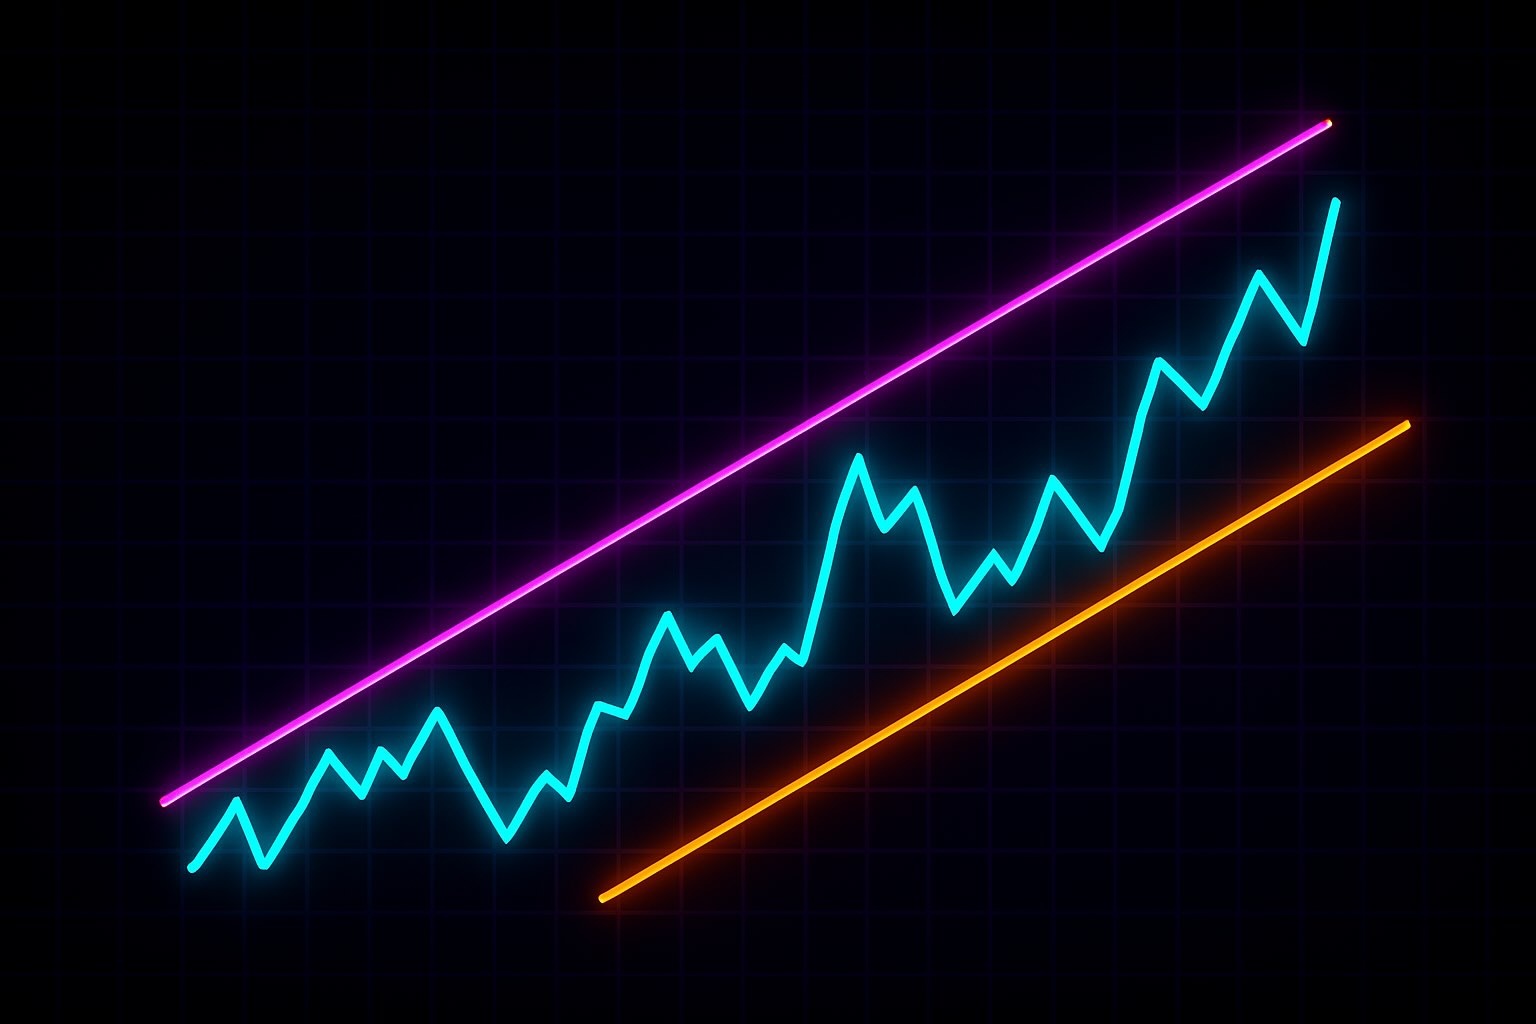
ATR doesn’t react to price direction — it reacts to range expansion.
That’s what makes it useful. It keeps you focused on what the market is actually doing — not what you want it to do.
Ava reads the ATR line the same way she reads price:
ATR doesn’t provide an edge on its own.
It helps you stay within the limits of what the market can reasonably do.
If the move is too slow — you risk overtrading.
If it’s too volatile — you risk being shaken out.
Ava uses ATR not to decide what to trade — but to decide how to approach it.
Ava doesn’t treat ATR as a signal.
She uses it as a filter — a way to shape her trades around the market’s actual pace.
Before every setup, she checks the current ATR value and compares it to recent levels.
Has volatility expanded — or compressed?
She doesn’t need a perfect number. She just wants to know:
Is the market calm, balanced, or unstable?
If volatility is low, she adjusts.
She trades smaller ranges, uses tighter stops, and waits for clean structure.
She’s cautious about chasing breakouts — because she knows low ATR often leads to failed momentum.
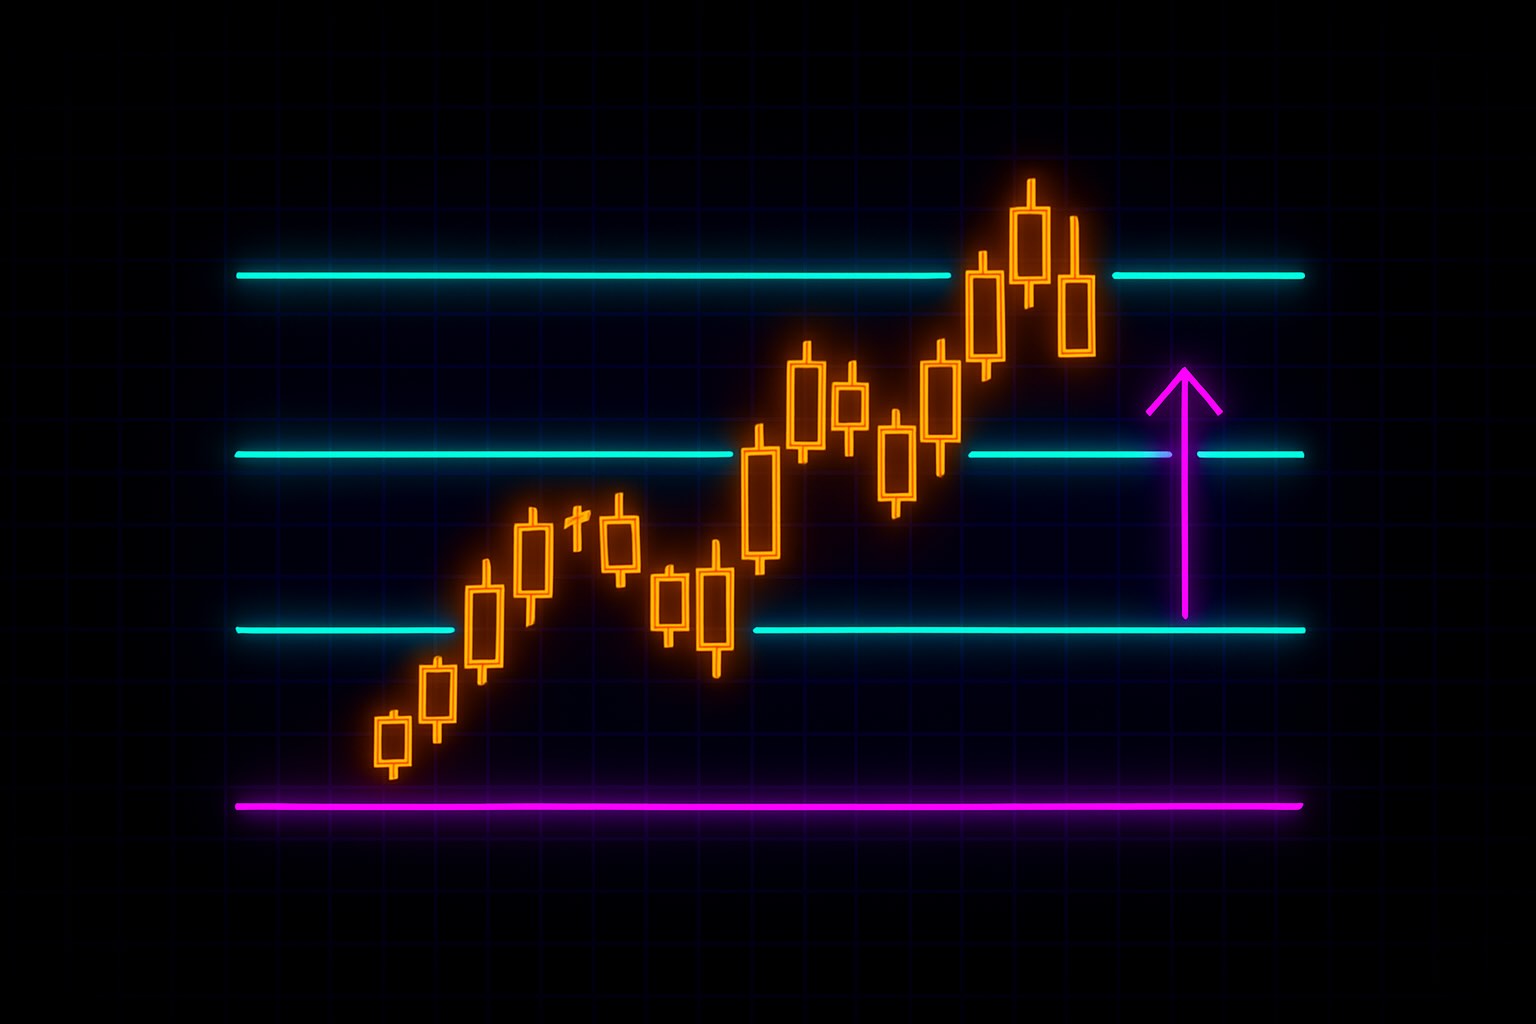
If ATR is rising, she does the opposite.
She widens her stops, reduces size, and expects faster movement.
But she’s also alert — rising ATR can signal opportunity, or chaos.
When ATR is climbing fast and price is stretching, Ava considers time stops. She gives the trade less room to wander — because she knows the environment is less forgiving.
She also checks ATR during trades — not just before.
If volatility begins to collapse after her entry, she reassesses. A fast drop in ATR may mean the move is losing steam.
ATR doesn’t tell her what to trade.
It tells her how to trade it — or when to back off.
Average True Range isn’t about direction. It’s about environment.
It tells you how much the market is moving — not where it’s going. And that insight helps you stay aligned with what the market can realistically offer.
At Kodex, we don’t use ATR to find entries.
We use it to adapt — our size, our stops, and our expectations.
When volatility expands, we widen our parameters.
When it fades, we stay precise — or stay out.
ATR doesn’t eliminate risk.
But it helps you shape risk around what the market is capable of — not what you hope for.
Let ATR frame your risk.
Let structure shape your strategy.
And let volatility guide how you move — not whether you move.