
Want to know if a move has real strength behind it — or if it’s already losing steam?
The Relative Vigor Index (RVI) helps you spot momentum that’s steady, not just fast.
You’ll learn how to read RVI crossovers, understand what rising or flattening lines mean, and use it to confirm when a trend is likely to hold — or when it’s time to wait.
Let's begin.
The Relative Vigor Index (RVI) is a momentum indicator — but unlike others, it’s designed to measure how stable and consistent that momentum actually is.
The core idea behind RVI is simple:
In a healthy uptrend, price should close near the high of the candle.
In a downtrend, it should close near the low.
The RVI turns this principle into a structured signal — comparing closing strength to the trading range, and smoothing the results to identify whether bulls or bears have control over time.
It’s not about sharp spikes or volatility.
RVI is built to track balance within strength — showing whether a move is energetic and consistent, or fading and uneven.
Used well, it helps you stay aligned with real momentum — not just temporary acceleration.
The Relative Vigor Index compares closing price to the trading range of each candle — then smooths that information over time to reveal consistent directional energy.
Here’s what it’s built on:
RVI captures that tendency by calculating:
This ratio is then smoothed using a moving average to reduce noise — creating the RVI line.
A second line — the Signal Line — is a moving average of the RVI itself.
This gives you a visual way to track crossovers and changes in momentum.
What this gives you:
The steeper the slope, the stronger the momentum.
The flatter the line, the more balanced or indecisive the market becomes.
RVI doesn’t respond to every price fluctuation.
It’s designed to highlight momentum that is measurable and sustained — not just fast.
The Relative Vigor Index is most useful when you want to validate momentum — to confirm that a move has strength behind it, and that it’s not just a short-term spike.
It works best when:
The RVI is especially effective when:
But it’s less reliable when:
RVI is a tool for confirmation, not prediction.
It doesn’t tell you when to enter. It tells you whether the energy behind a move is real — or already fading.
Let’s follow Ava — a trader who uses momentum confirmation to filter out noise and avoid false moves.
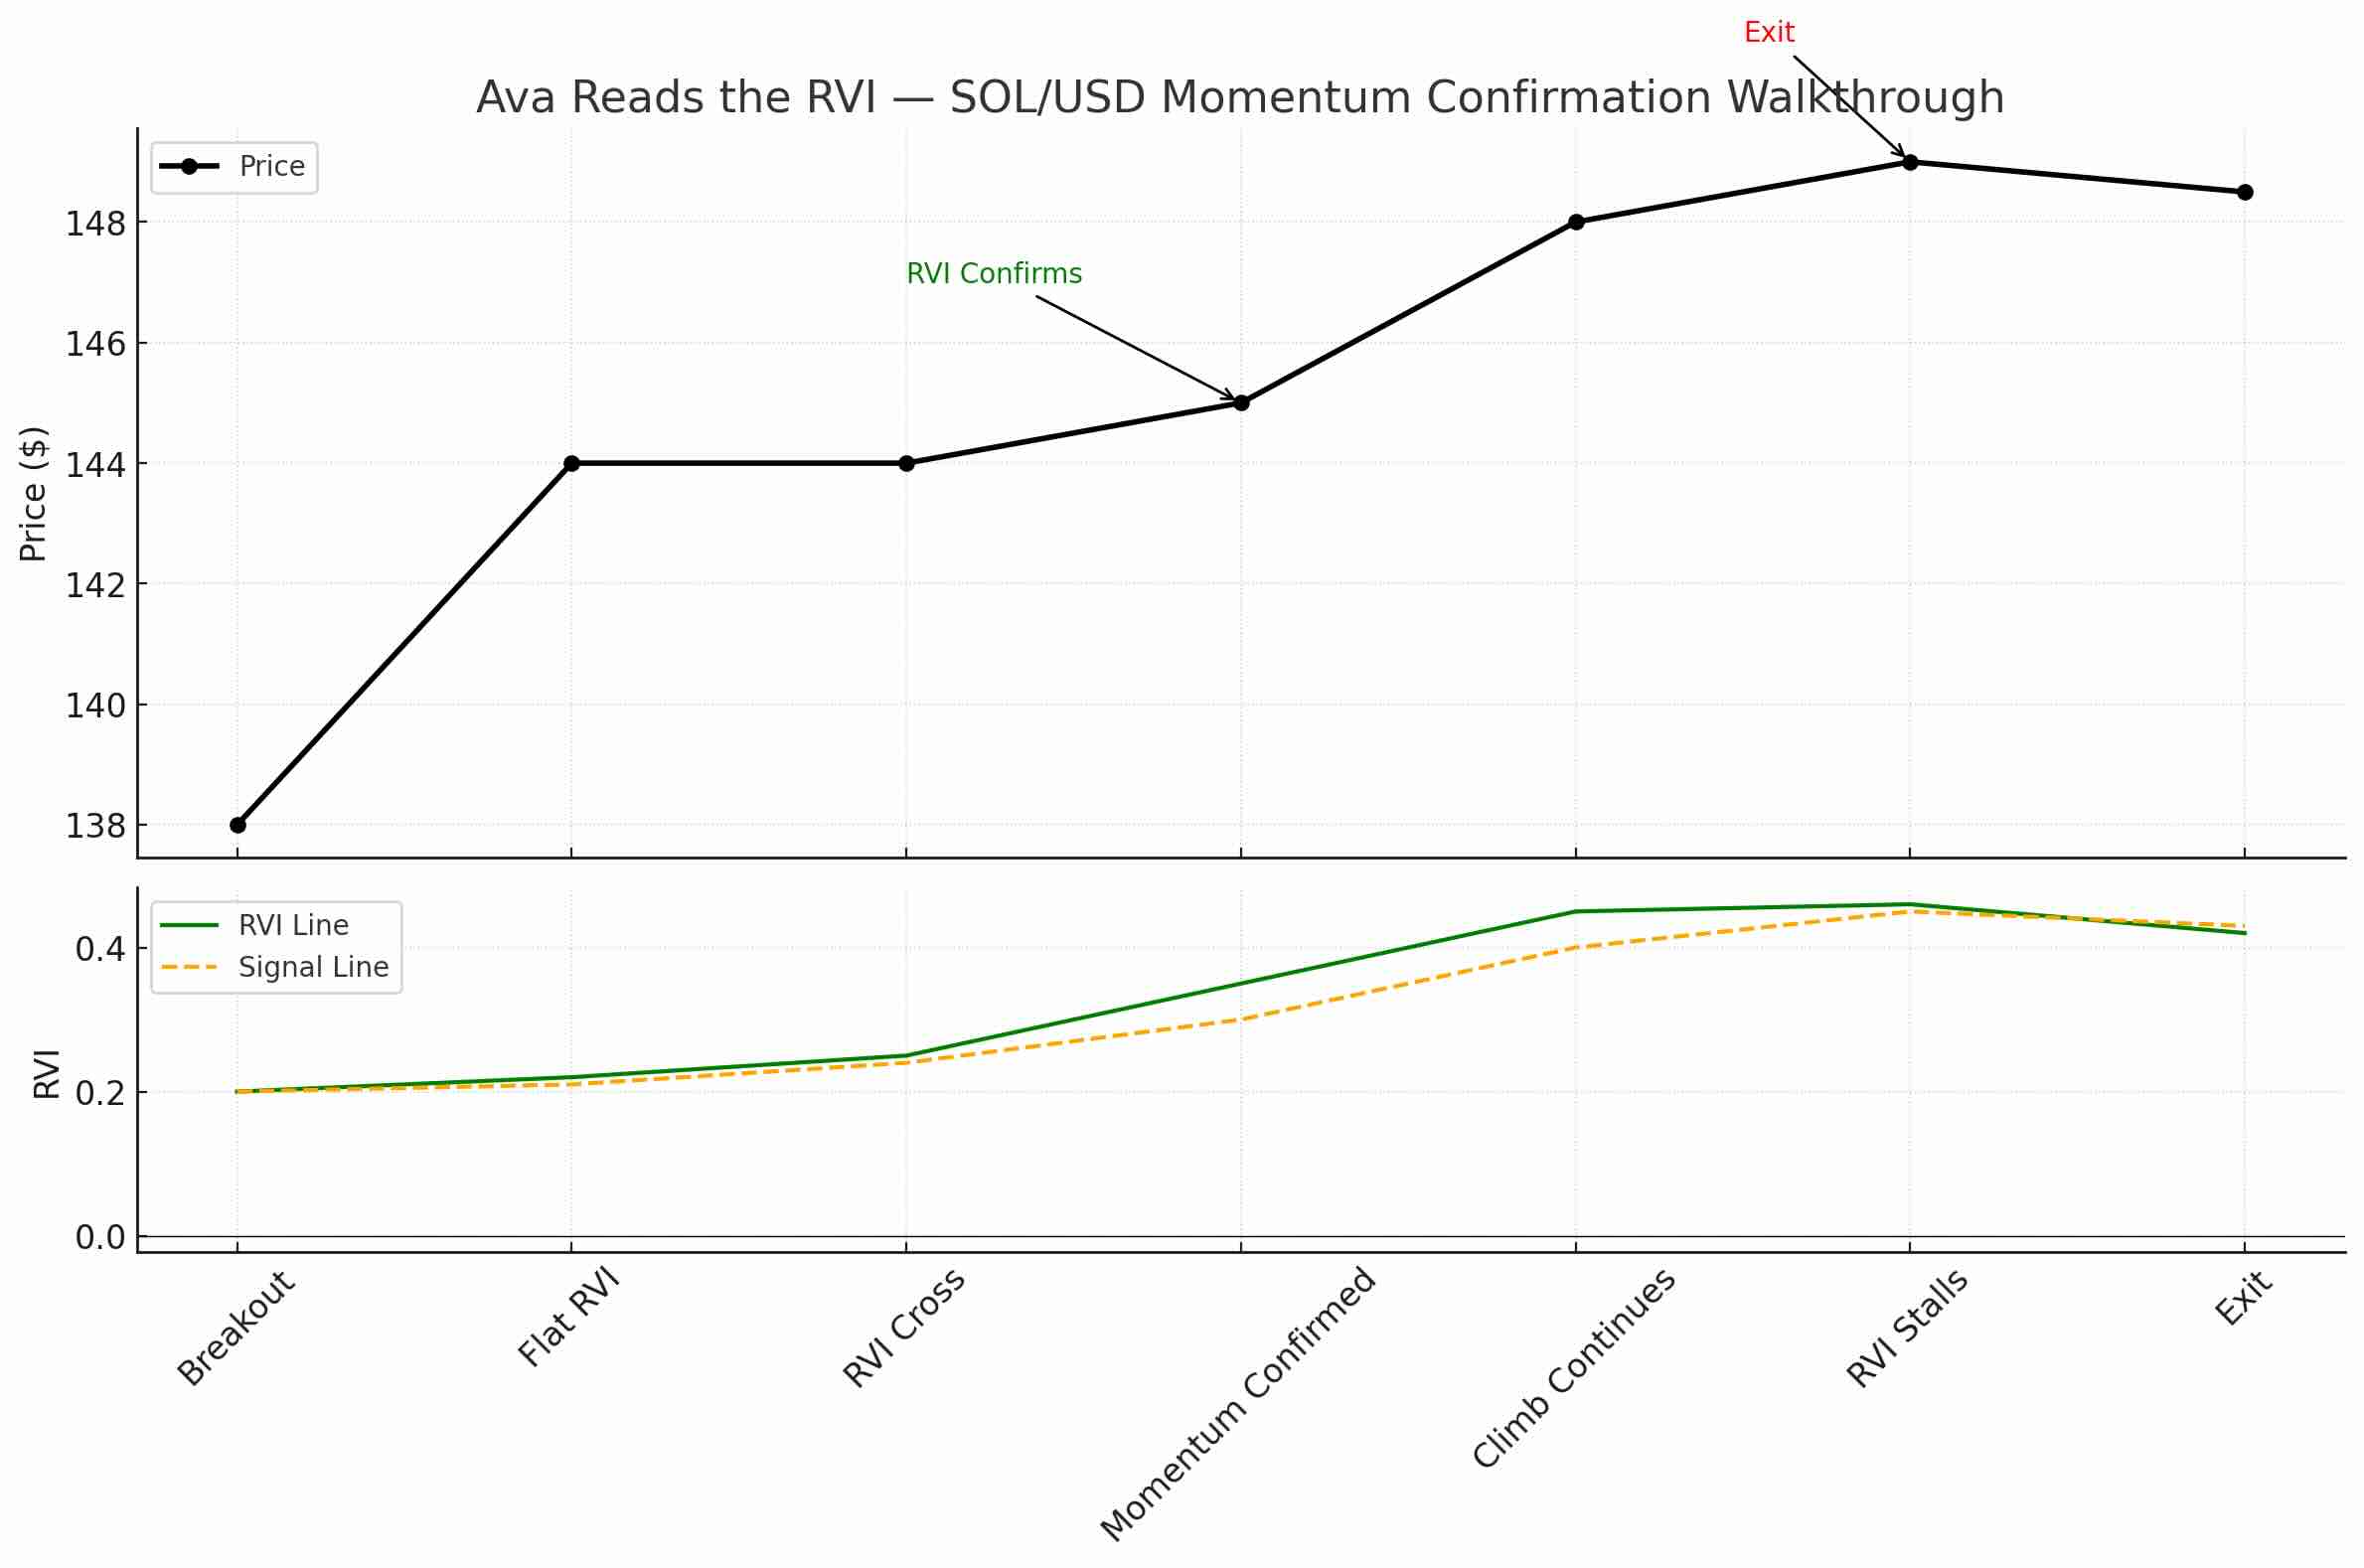
It’s Thursday. Solana (SOL) has just broken out above a short-term resistance level at $138. Price pushes up to $144 in a sharp move. On the surface, it looks clean — but Ava doesn’t act on breakouts alone.
She checks the RVI to assess the move.
At first glance, price is climbing, but the RVI line is still flat — hovering near its Signal line, showing little directional momentum. There’s no clear slope. This tells Ava that the breakout may be lacking follow-through.
She waits.
An hour later, she sees something change. Price holds above the breakout zone. The RVI line begins to rise, and more importantly — it crosses above the Signal line, with both lines pointing upward.
She looks back at the candles — the last three closes were all near their highs.
This confirms that buying pressure is not only present, but consistent.
Now Ava enters long — not because price broke out, but because momentum confirmed that the move had energy.
She places her stop just below the breakout structure at $137. Her initial target is $150 — a key round number and local high.
As price climbs, the RVI continues to rise. Ava watches for flattening.
Near $149, she notices the RVI starting to stall. It turns sideways, and price begins to slow.
Rather than wait for a reversal, Ava exits the position. The move may continue — but momentum has shifted, and her reason for staying in is no longer valid.
The RVI didn’t tell her what would happen.
It told her whether the move was strong enough to trust.
The RVI is most useful when you read the slope, position, and behavior of the lines — not just the crossover itself.
Here’s how Ava approaches it:
The RVI is not a trigger — it’s a filter.
It doesn’t tell you what to do.
It tells you whether the move has the strength to continue — or whether it’s losing steam beneath the surface.
Ava uses the Relative Vigor Index to filter noise — not to find trades.
She starts by checking whether price action suggests a possible shift: a breakout, a trend developing, or a reversal forming. But she doesn’t act on price alone. She looks to the RVI to confirm that the move has real momentum behind it.
Her first step is to check the slope. A rising RVI means bullish momentum is building. A falling line warns her that energy is weakening. If both lines are flat, she steps aside — the market isn’t showing a clear directional bias yet.
Next, she watches for a crossover — but only if it’s happening in a meaningful place. A crossover near the top or bottom of the range is more significant than one in the middle. And a crossover with slope carries more weight than one that’s shallow or sideways.
She compares what the RVI is showing with what price is doing. If they’re aligned, she takes interest. If price is rising but RVI is falling — or stalling — she takes that as a sign to wait.
Ava never enters a trade just because the RVI crosses.
She enters when price, structure, and momentum all point in the same direction.
And once she’s in, the RVI continues to guide her.
If it starts flattening or diverging from price, she prepares to exit — not out of fear, but because the conditions that supported the trade have changed.
For Ava, the RVI is about clarity.
It tells her when a move is real — and when it’s already losing conviction.
Momentum isn’t just about speed. It’s about consistency — and the Relative Vigor Index helps you measure that.
It doesn’t react to every spike. It tracks whether the market is closing with intent — again and again. That makes it useful for confirming whether a trend has strength, or if it’s just noise wrapped in volatility.
At Kodex, we don’t rely on indicators to make decisions for us.
We use them to filter distraction and strengthen clarity.
RVI shows you whether the energy behind a move is still present — or already fading.
If price and structure align, and momentum confirms — we engage.
If they don’t, we wait.
Let the RVI confirm what price is trying to do.
Let divergence or flattening guide your caution.
And let structure, not emotion, lead the decision.