
Price moves a lot — but not every move matters.
Moving averages help you zoom out and focus on the bigger picture — the trend, not the noise.
In this lesson, you’ll learn how to use moving averages to see where the market is really going, when a trend is strong, and when it might be losing momentum.
You’ll see how Ava uses the slope and price behavior around the averages to stay with strong moves — and step back when things get messy.
Because it’s not about speed.
It’s about seeing clearly.
Let’s begin.
Moving averages are among the most commonly used tools in technical analysis — and also the most misused.
At their core, moving averages smooth out price over time. They help you step back from short-term noise and focus on the overall direction of the market — the slope, not the spikes.
There are different types — simple, exponential, weighted — but all serve the same purpose:
To reveal the average path of price over a defined period.
But a moving average isn’t a signal.
It’s a reference point — showing whether price is trending, consolidating, or diverging from structure.
Used properly, moving averages offer more than just trend direction.
They can highlight momentum shifts, dynamic support and resistance, and the strength or weakness of the current move.
The real value isn’t just in what the average shows —
It’s in how price interacts with it.
There are several types of moving averages, but the most commonly used are:
Both types help reveal trend direction — but the interpretation lies in the slope and relationship between price and the line.
Here’s how Ava reads them:
When using two or more averages, their interaction adds context:
The moving average itself doesn’t generate the insight.
The insight comes from how price respects or rejects it — and how those averages behave in relation to each other.
Moving averages are most effective when you want to understand the direction and structure of a trend — and whether price is respecting that structure or breaking away from it.
You use them when:
They work best in trending environments. When price moves in clean waves, moving averages often act as support or resistance, showing where pullbacks might hold or where momentum might resume.
But they're less useful in choppy or sideways markets.
If price constantly crosses the average with no follow-through, Ava treats it as a sign to wait — not to react.
The key isn’t just whether price crosses the average.
It’s whether price respects it, holds above it, retests it, or rejects it with intent.
Moving averages also gain value when used together:
When they’re all aligned — with price above all three, and each one sloping upward — structure is strong. When they’re mixed or tangled, it’s a sign of indecision.
Moving averages won’t give you the trade.
But they will help you understand whether the move has structure behind it — or not.
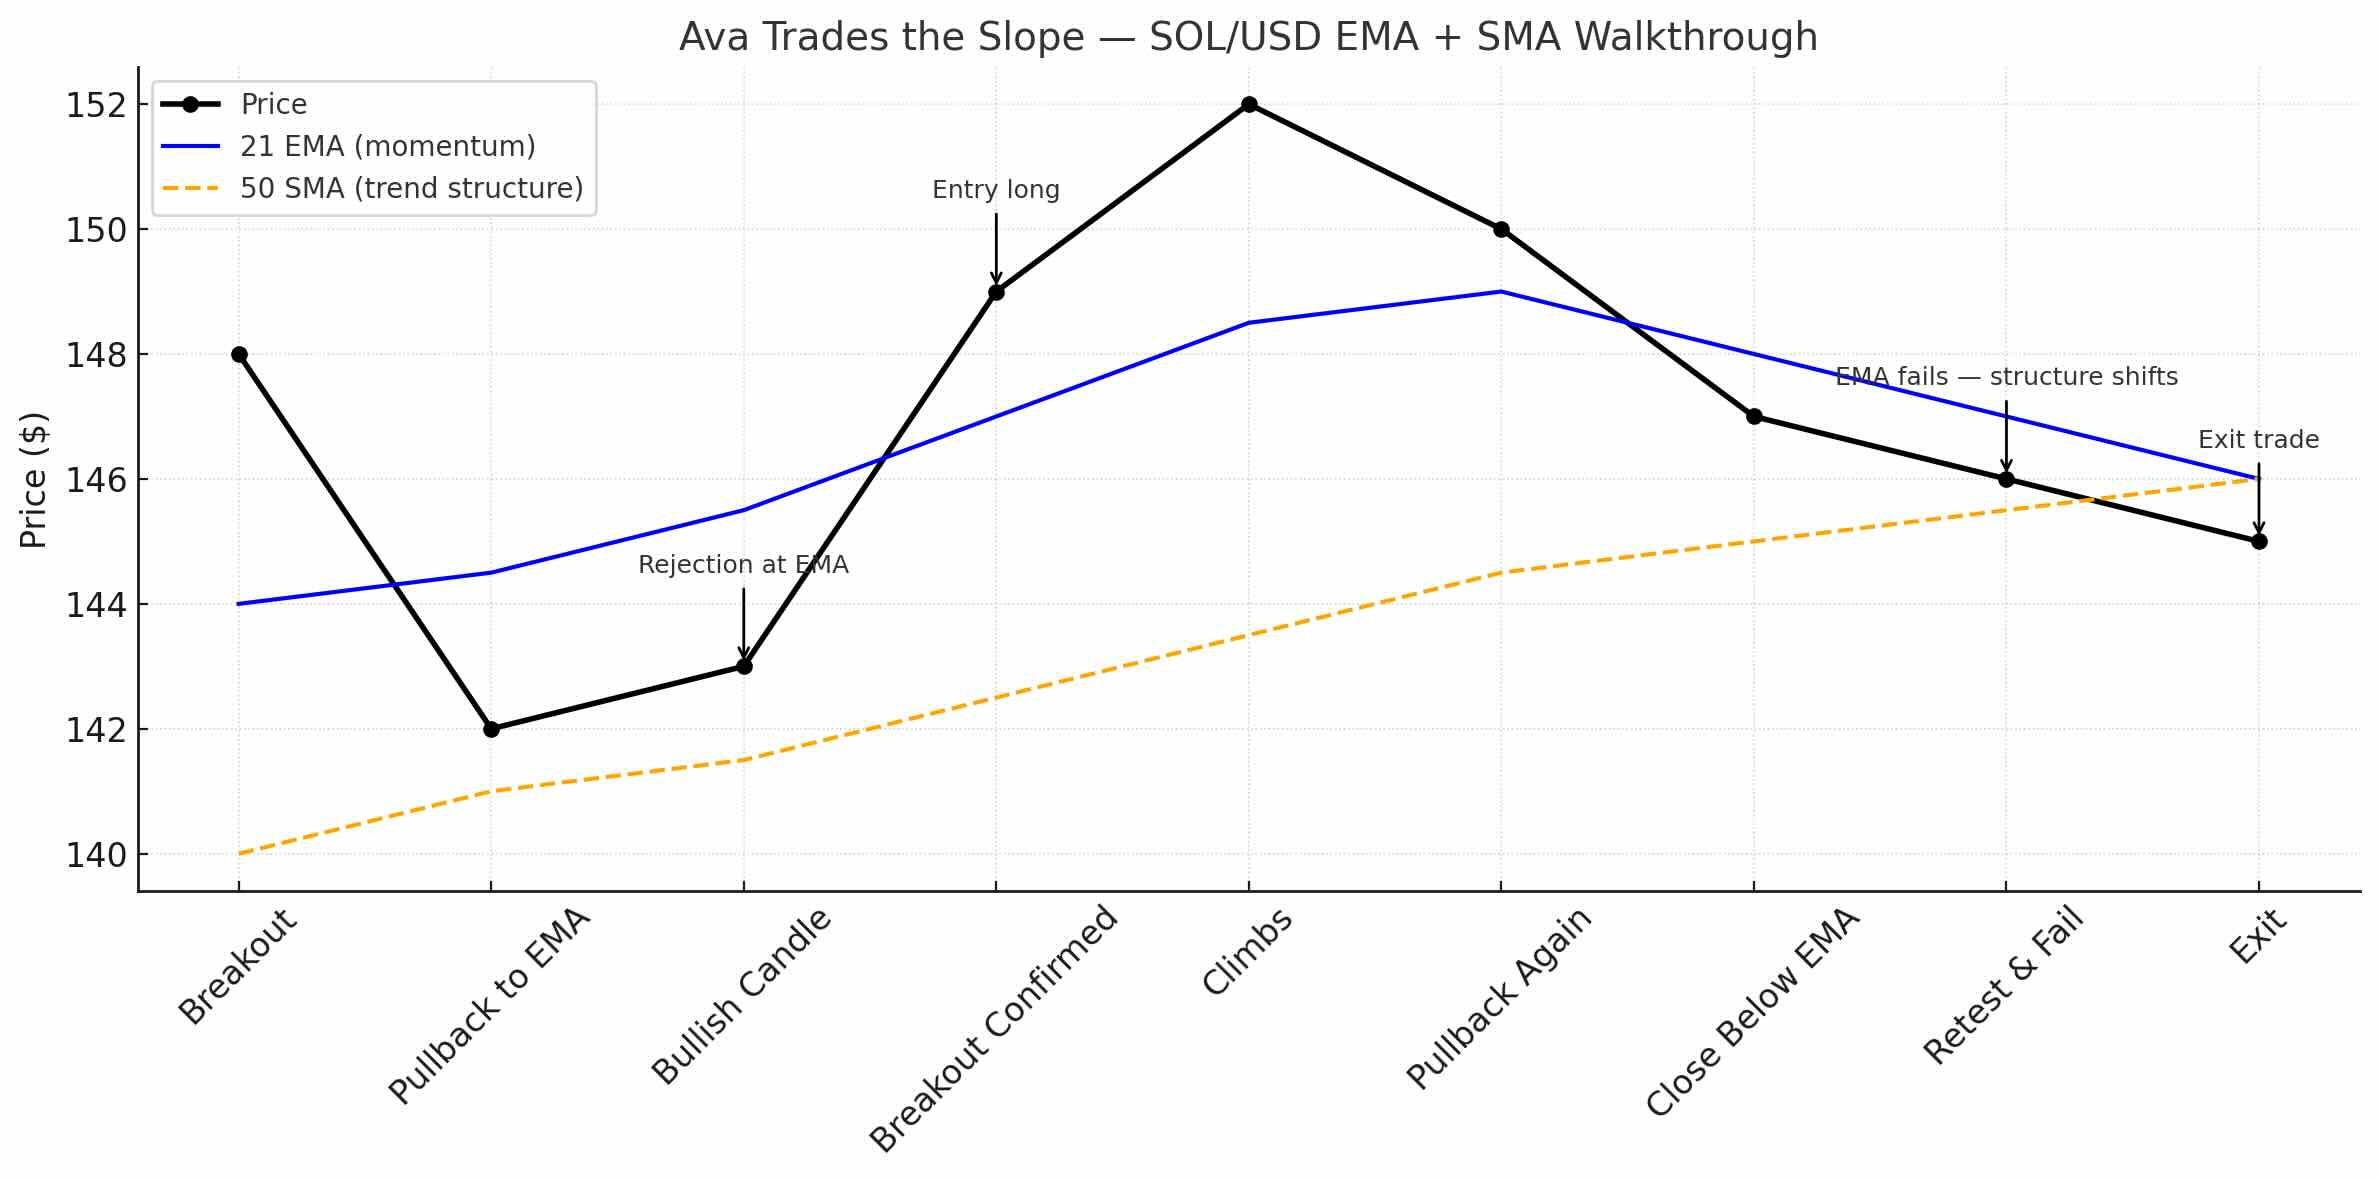
Ava is watching Solana (SOL) on the 4-hour chart. Price has recently broken out of a consolidation zone and is now climbing with conviction.
She overlays two moving averages on her chart:
As price pulls back from $148 to $142, Ava sees the 21 EMA still sloping upward, and price starting to stabilize just above it. She doesn't act yet. She's waiting to see if the moving average will hold — or break.
Volume increases. A bullish candle forms, rejecting the 21 EMA with a long lower wick.
Ava considers that a first signal of strength. But she looks for confirmation.
Two candles later, price closes strong above the previous high — a breakout with support from both volume and structure.
She enters long.
As the trade develops, price continues to ride the 21 EMA. Whenever it dips slightly, it finds support at the average and pushes higher. Ava uses the EMA as a trailing reference — not for exact levels, but for behavior.
Eventually, the 21 EMA starts to flatten. Price closes below it — then retests and fails to reclaim.
Momentum is stalling.
Ava exits the trade. Clean structure in. Clean structure out.
She didn’t enter on the cross. She didn’t exit on instinct.
She used slope, alignment, and reaction — and let the averages tell her when the move had strength… and when it didn’t.
A moving average doesn’t cause price to move.
It reflects what price has done — and gives you a clearer view of what it’s doing now.
Ava doesn’t trade the crossover. She watches how price behaves around the average before making any decision.
Here’s what she looks for:
Ava treats moving averages as behavioral reference points — not lines to trade blindly.
She doesn’t trade the touch.
She trades the reaction — and what that reaction tells her about the strength or weakness of the trend.
Ava doesn’t use moving averages as triggers.
She uses them to assess trend health — and decide whether structure is strong enough to support a trade.
She begins by identifying the environment. If price is ranging or directionless, she sets the averages aside. If price is moving clearly, she overlays a short-term and medium-term average — usually something like a 21 EMA and a 50 SMA — to frame the trend.
Next, she looks at the slope.
If both averages are angled in the same direction — and price is respecting them — she knows the trend has form. But slope without behavior means nothing.
She watches how price interacts with the averages.
She doesn’t trade the moment price touches the line.
She waits for confirmation: a reaction, a strong close, a clean rejection.
She also checks alignment.
When the faster average is above the slower one in an uptrend — and price is above both — she treats that as confirmation of trend strength.
If the averages cross or start to flatten, she becomes cautious.
Throughout the trade, Ava uses the averages as context, not commands. If price breaks below the 21 EMA and fails to reclaim, she considers the move weakening. If the 50 SMA holds and price responds with strength, she stays in.
For Ava, moving averages don’t give the signal.
They help her read the behavior — and stay aligned with the slope that matters.
Moving averages aren’t about prediction. They’re about pace.
They show you how price has behaved over time — and whether the current move has structure behind it or not.
At Kodex, we don’t trade a crossover.
We observe the slope. We watch the reaction.
And we use moving averages as a lens — not a trigger.
If price is respecting the average and structure is aligned, we stay with the move.
If price breaks structure or momentum fades, we step back.
The value isn’t in the line.
It’s in how price responds to it — and whether that response matches what the market has been showing you all along.
Let the average frame the trend.
Let the slope guide your awareness.
And let structure — not speed — shape your decision.