
If you’ve ever looked at a chart and thought, “I have no idea where we are in this move” — this is for you.
In this lesson, you’ll learn how to spot the phases of a trend using wave patterns, how to tell if momentum is building or fading, and how to time your trades with more confidence — without guessing tops or chasing bottoms.
You’ll learn to recognize early-stage trends, signs of exhaustion, and key correction patterns that most traders overlook.
No perfect counts. No forced patterns.
Just a clearer way to read what the market is actually doing — and what it might do next.
Because once you understand the rhythm, the chaos loses its power.
Let’s begin.
Markets often look chaotic — full of noise, false moves, and unpredictable swings. But behind the disorder, some traders believe there’s a deeper rhythm.
Elliott Wave Theory is built on that idea: that price moves in repeating cycles of expansion and correction. These cycles reflect shifts in crowd psychology — optimism, fear, exhaustion, and recovery — and often unfold in recognizable patterns.
The theory outlines how trends move in waves: five waves in the direction of the trend, followed by three waves in the opposite direction. These aren’t exact rules — they’re frameworks for identifying structure when the market feels unstructured.
Elliott Wave doesn’t tell you what will happen next.
It helps you recognize where the market might be in the cycle — and whether the energy behind a move is likely to continue or collapse.
Used carefully, it offers clarity in places that often feel uncertain.
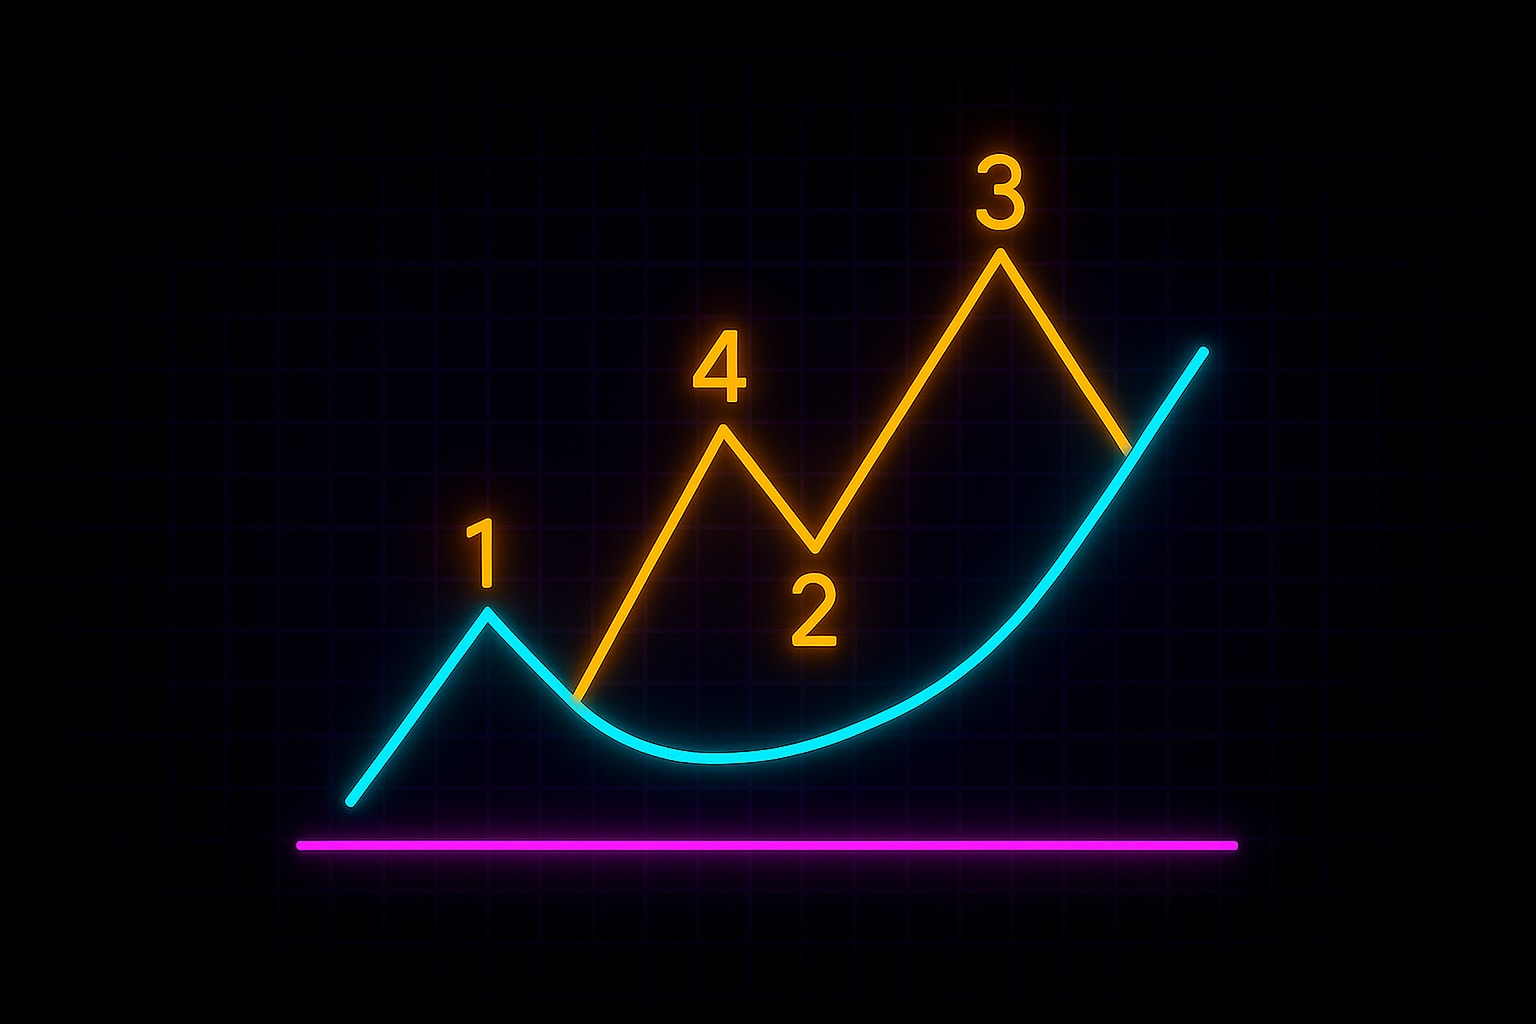
Elliott Wave Theory is based on the idea that markets move in two phases: impulse and correction.
Each full cycle consists of:
Let’s break them down.
Impulse Phase: Waves 1–5
These five waves form the trend.
Corrective Phase: Waves A–B–C
These three waves move against the trend.
The wave structure reflects shifting sentiment and energy in the market — not fixed timeframes or prices.
And while it may look neat in theory, waves in real markets often overlap, stretch, or distort. That’s why the goal is not to label perfectly — it’s to recognize the rhythm of where you are in the broader cycle.
The real value in Elliott Wave isn’t counting.
It’s understanding when a move is just beginning — or starting to exhaust.
Elliott Wave Theory is most useful when you’re trying to understand where you are within a larger move — not just where price is, but how far along the behavior behind it has progressed.
You use it when:
It’s especially valuable in strongly trending markets, where waves unfold more clearly. It also helps during corrections, when price seems to be retracing but hasn't broken structure completely.
But Elliott Wave Theory isn’t something to force onto every chart.
It’s less effective when:
At its best, it adds context — not prediction.
Elliott Wave is not about finding the perfect wave count.
It’s about recognizing when momentum is building, and when it’s likely starting to fade.
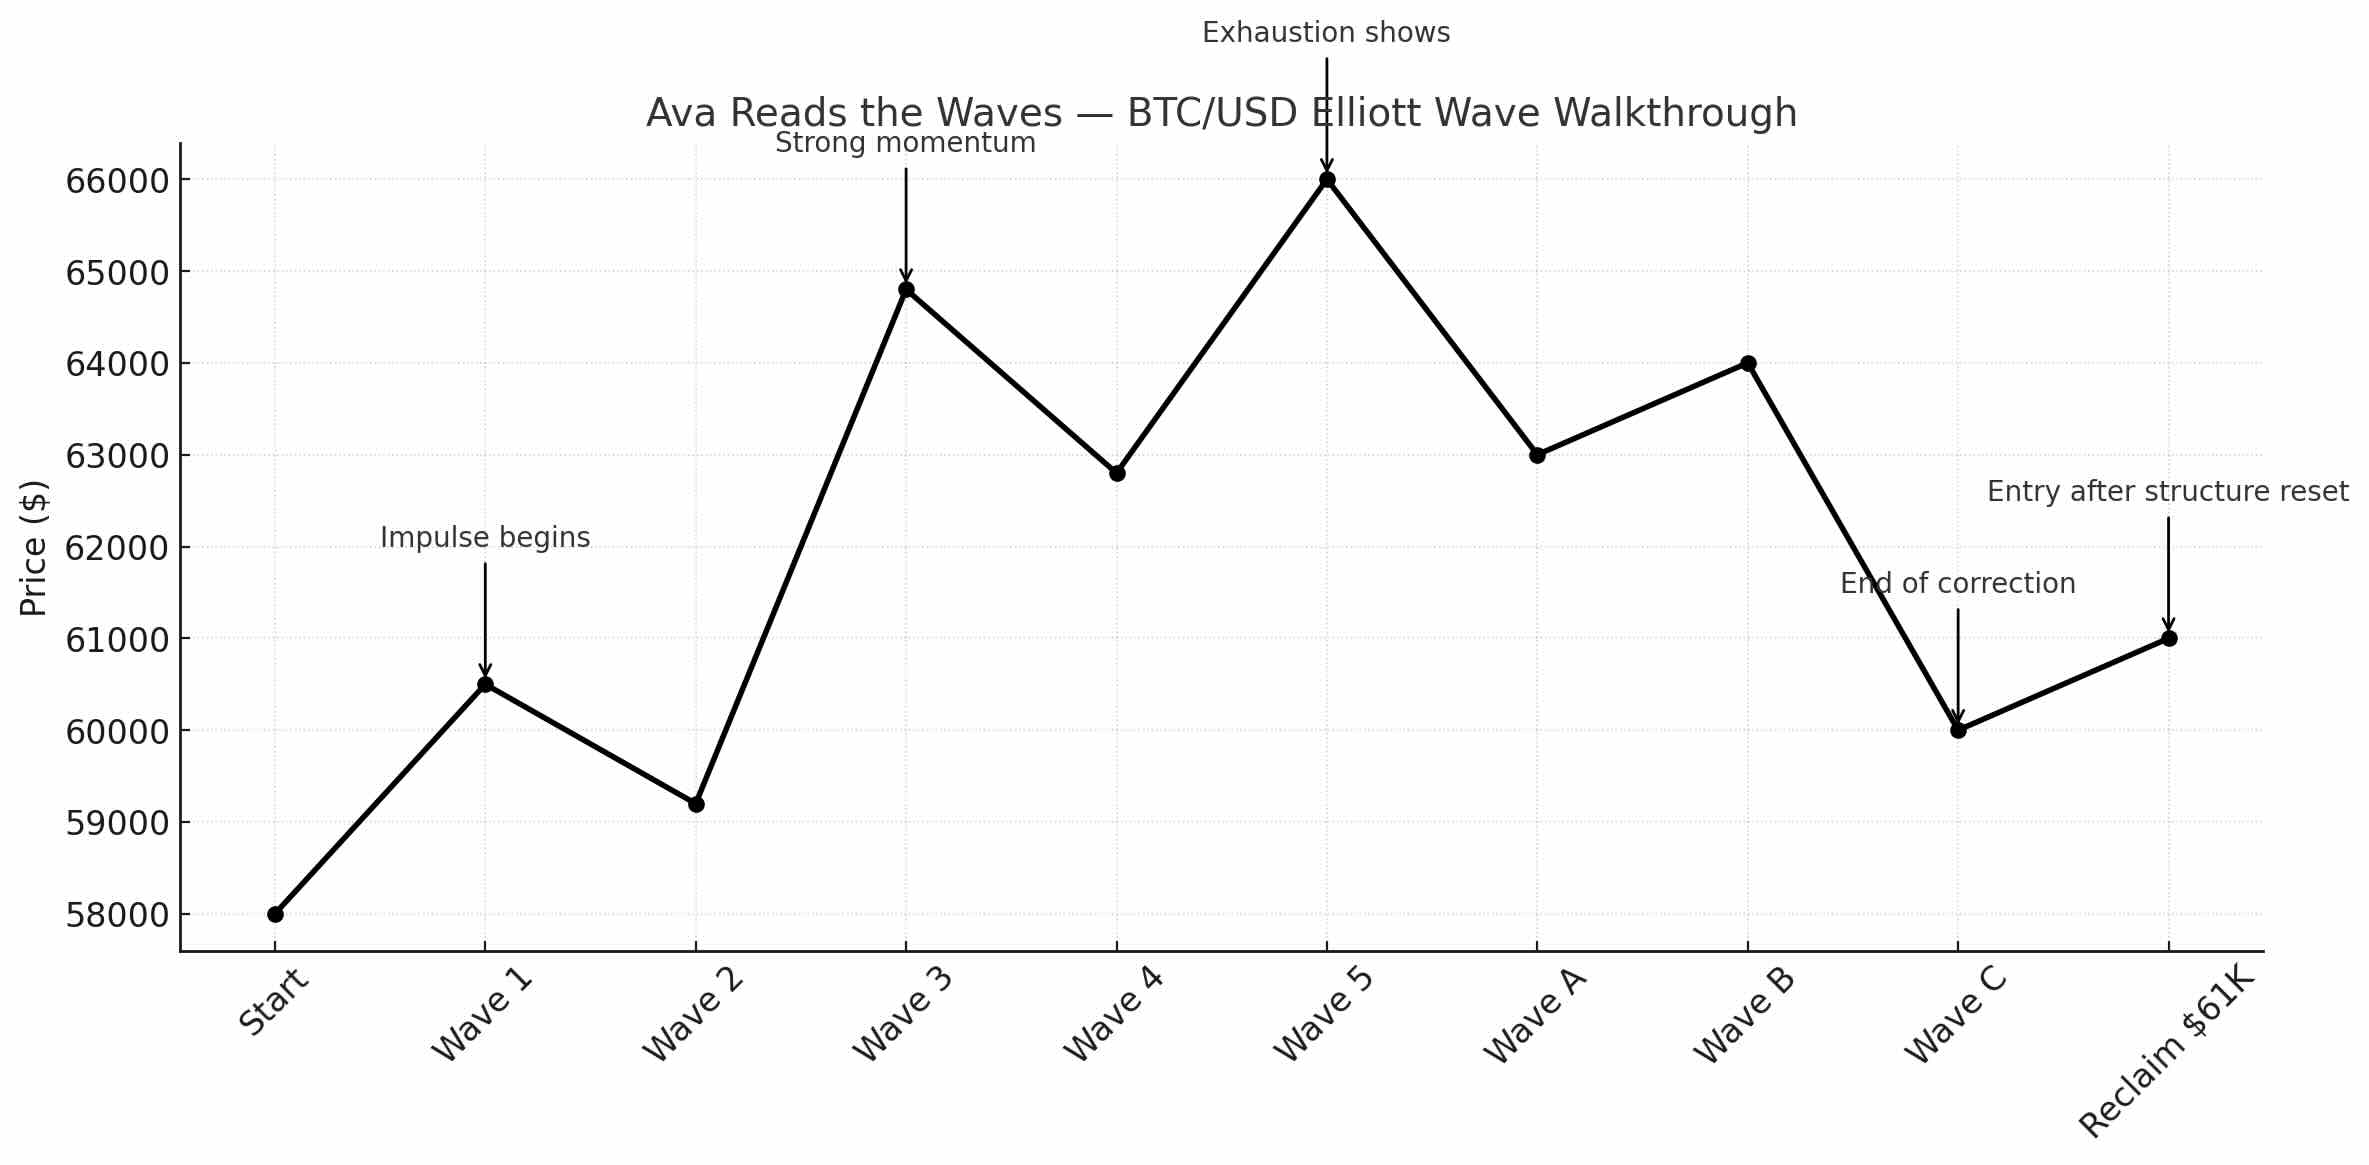
Let’s follow Ava — a swing trader focused on momentum and structure, not guessing tops and bottoms.
It’s early April. Bitcoin has been climbing steadily from $58,000 to $66,000 over the past three weeks. The move has had clear pauses and reactions, but overall, it’s been directional. Ava sees potential for a larger cycle unfolding — and begins mapping the possible waves.
She starts at $58,000, where the trend first turned. The next three pushes and pullbacks catch her eye.
She doesn’t jump in late. Instead, she waits for a correction.
To Ava, this is a sign of exhaustion — not failure, but the end of a cycle.
She watches for a correction phase. Price begins to roll over.
Now Ava has context.
She doesn’t trade every wave. She doesn’t label obsessively.
She uses the rhythm of expansion and correction to guide her positioning.
In this case, she enters after the ABC correction, once price reclaims $61,000 with strength and structure resets.
Elliott Wave didn’t give her a signal.
It gave her a timeline — and a better sense of where the market might be in that timeline.
Elliott Wave Theory isn’t about labeling perfect waves.
It’s about understanding what the market is trying to do — and where it might be in that process.
Ava doesn’t focus on drawing the cleanest 1–5 or ABC. She focuses on how price behaves at key turning points between waves.
Here’s what she watches for:
The key isn’t trying to be right.
It’s recognizing when behavior is consistent with where you think you are in the cycle.
If everything lines up — strong impulse, balanced correction, confirmed resumption — Ava considers a trade.
If waves stretch, overlap, or collapse with no rhythm — she waits. No pattern is better than a forced one.
Elliott Wave isn’t the entry.
It’s the context around the entry.
Ava doesn’t start by labeling waves. She starts by asking a simple question:
Is this market expanding — or correcting?
She looks for clear movement in one direction, with pullbacks that respect structure. If she sees a pattern forming, she marks the start — but only loosely. She’s not trying to forecast every swing. She’s tracking rhythm.
She knows that Wave 3, if it appears, is often the strongest and most reliable. So she’s most interested in entering during Wave 2 corrections, and exiting during or after Wave 5. That’s where reward often begins to shrink, and risk increases.
She doesn’t assume every five-leg move will be clean. She’s prepared for distortions — extended waves, truncated tops, or overlapping corrections. If the structure breaks down, she doesn’t force a new label. She re-evaluates.
During corrections, Ava is patient.
She watches how Wave B behaves — if it’s weak, she expects a deeper Wave C.
If it’s strong, she considers that the trend may already be trying to resume.
Throughout the process, she treats wave theory as a framework — not a trigger.
It helps her map the phase of the market.
But it’s confirmation and structure — not labels — that determine when she acts.
Elliott Wave Theory isn’t about precision. It’s about rhythm.
It gives you a way to understand where the market might be in its cycle — whether it’s building momentum, fading out, or resetting entirely. That context helps you prepare, stay patient, and recognize when the structure supports the trade — and when it doesn’t.
At Kodex, we don’t use waves to predict price.
We use them to frame what the market is doing — and how far it might have come.
If the behavior fits the structure, we pay attention.
If it doesn’t, we don’t force the count.
Wave theory doesn’t replace observation.
It helps you slow down, see the bigger picture, and trade with more clarity.
Let structure reveal the phase.
Let confirmation guide the trade.
And let rhythm — not reaction — shape your decision.