

In this lesson, you’ll learn how to use Bollinger Bands to spot compression before it breaks, confirm momentum when it expands, and avoid chasing moves with no real backing.
Because the edge isn’t where price touches the band.
It’s how the market reacts once it does.
Let’s begin.
Markets don’t move with consistent speed. They contract, expand, pause, and surge. Bollinger Bands help you observe that shift — not through price alone, but through volatility.
Bollinger Bands consist of three lines:
When the bands are tight, volatility is low — the market is compressing.
When the bands widen, volatility is expanding — and a breakout may already be in motion.
But Bollinger Bands aren’t a prediction tool.
They don’t tell you which direction price will go.
They show you when the conditions for movement are building or unfolding.
Used properly, they help you understand when the market is preparing for change — and whether that change is already underway.
Bollinger Bands are built around a moving average — typically a 20-period simple moving average — with two outer bands set a fixed number of standard deviations above and below.
The result is a dynamic channel that expands and contracts based on how volatile the market is.
Here’s how each part works:
When price hugs the upper band, it doesn’t mean the market is overbought.
When price touches the lower band, it’s not necessarily oversold.
Instead, the bands help you read context:
The key is not the touch. It’s the reaction around the band — and whether it happens in a compressed or expanded state.
Bollinger Bands are not fixed levels.
They reflect the rhythm of the market — expanding and contracting as energy builds and releases.
Bollinger Bands are most useful when you want to understand how the market is behaving around volatility — not just where price is, but how much space it has to move.
They’re especially effective in two situations:
You can also use the middle band as a dynamic support/resistance level.
In strong trends, price often pulls back to the middle band before continuing. When that pattern breaks, it’s often a sign that the trend is weakening.
Avoid relying on the bands when:
Bollinger Bands don’t predict direction.
They show you whether the conditions for movement are tightening or expanding.
That alone can help you position better, enter with more awareness, and avoid trading in noise.
Let’s follow Ava — a short-term trader who uses volatility to time her entries and exits with structure, not speculation.
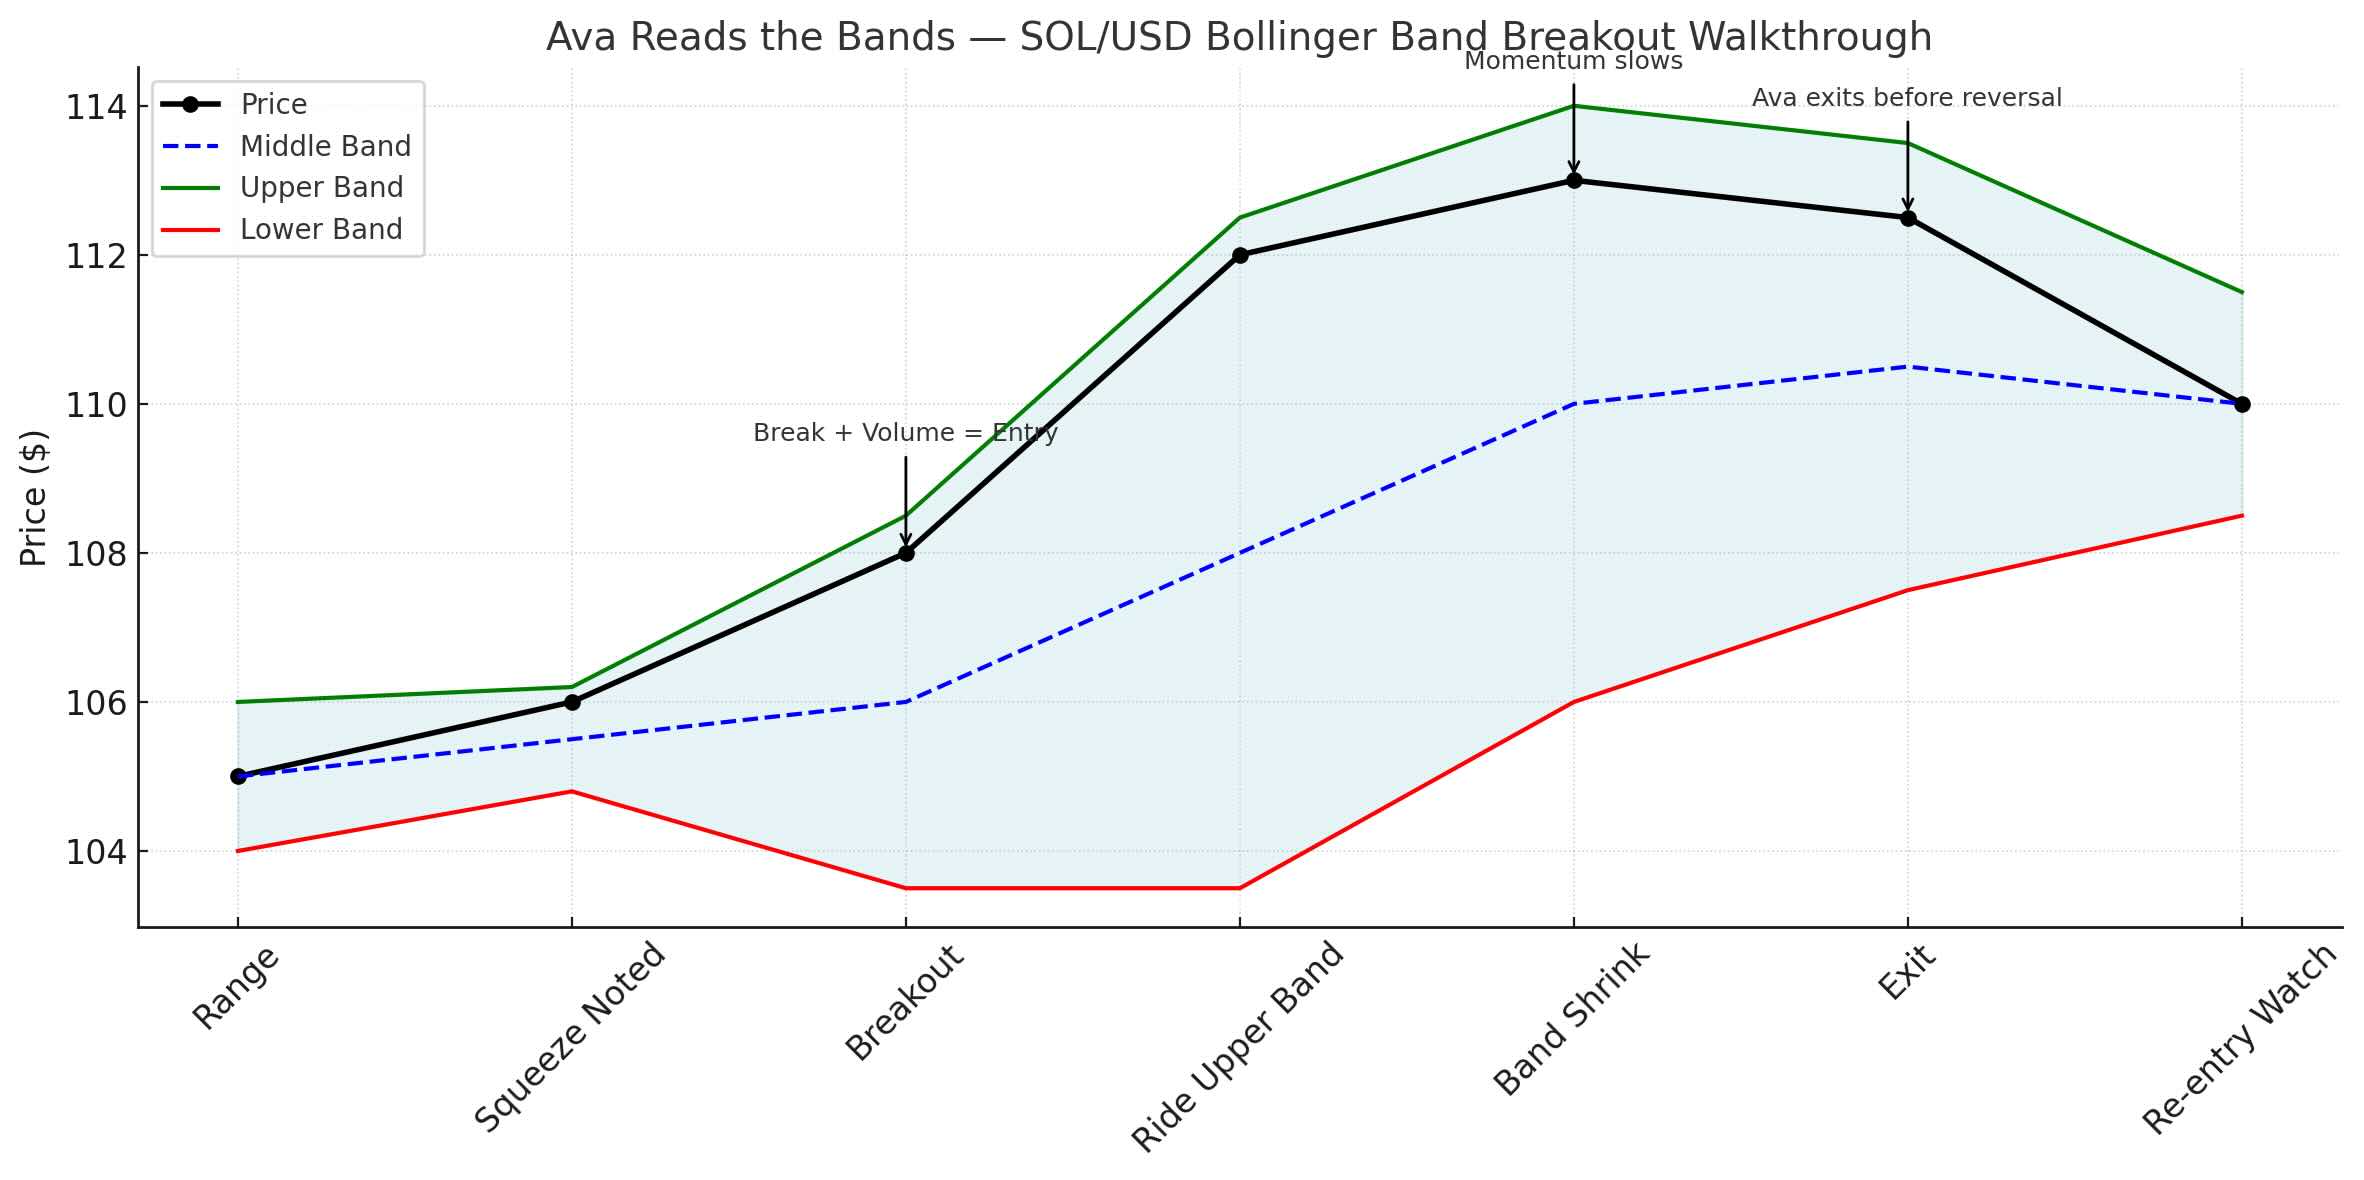
It’s Wednesday. Solana has been trading in a tight range between $104 and $107 for several days. Ava notices something important on the 1-hour chart:
The Bollinger Bands are squeezing — the tightest they’ve been in over a week.
Volume is low. Price is consolidating near the middle band.
This isn’t a trade yet — it’s a market holding its breath.
Ava doesn’t guess which way the breakout will go. She prepares for either direction, focusing on the reaction once expansion begins.
Later that afternoon, a strong bullish candle closes above the upper band — with volume.
That’s the confirmation she’s been waiting for.
She enters long — not because the band was touched, but because the market just expanded from compression, with structure and momentum aligned.
Her stop-loss goes just below the middle band — still inside the structure.
Her initial target is the next known resistance zone at $114.
As the trade develops, price hugs the upper band — not pulling back, not reverting. The bands are widening, showing that volatility is expanding with the move.
Eventually, Ava sees two signs:
She closes the trade — not because price reversed, but because the expansion phase is losing momentum.
A few hours later, price dips and re-enters the bands. Ava watches again — this time waiting for compression to rebuild before considering another entry.
She doesn’t use the bands to find signals.
She uses them to recognize where the energy is — and whether the structure supports acting on it.
Bollinger Bands aren’t designed to tell you when to buy or sell.
They’re built to help you read how price behaves around volatility — and whether structure is supporting the move or starting to weaken.
Here’s how Ava reads the reaction:
She also pays close attention to band shape:
What matters is not whether price hits the band — it’s what happens after.
Ava trades the reaction, not the edge.
She waits for price and volatility to move together — and for structure to confirm that the move is real.
Ava starts by scanning for compression.
If the Bollinger Bands are wide, she waits. But when they tighten — when volatility contracts and price begins to coil — that’s her signal to start watching.
She marks the current range and pays attention to how price behaves near the edges. Is there pressure building toward one side? Are volume and structure supporting a breakout — or is it all noise?
She doesn’t predict direction. Instead, she prepares for both.
If a strong candle breaks outside the band with volume, she considers entry — but only after a full close confirms it.
The middle band acts as her internal guide. In a developing trend, she uses it to trail stops or measure pullbacks. If price consistently respects the middle band, the structure is likely holding.
But Ava is careful with band touches.
She knows that price often reverts — especially when the breakout lacks momentum or the bands haven’t expanded. She watches how price moves relative to the band’s slope and width, not just its edges.
If price breaks the band and the bands start widening, Ava sees that as movement with intent.
If price breaks but stalls and reverts, she steps aside — or exits.
For Ava, Bollinger Bands don’t give signals.
They reveal when the market is shifting gears — and whether the structure behind that shift is strong enough to act on.
Bollinger Bands don’t forecast direction.
They help you recognize when the market is compressing, expanding, or drifting — and whether momentum is aligned with structure.
At Kodex, we don’t trade touches.
We trade behavior — how price reacts when volatility shifts.
When the bands are tight, we prepare.
When the breakout begins, we confirm.
When the expansion slows, we adjust.
Used well, Bollinger Bands help you stay patient during quiet phases — and confident when movement starts.
They filter out the noise and force you to focus on context — not just candles.
Let the compression set the stage.
Let the breakout show intent.
And let volatility — not emotion — guide your timing.